
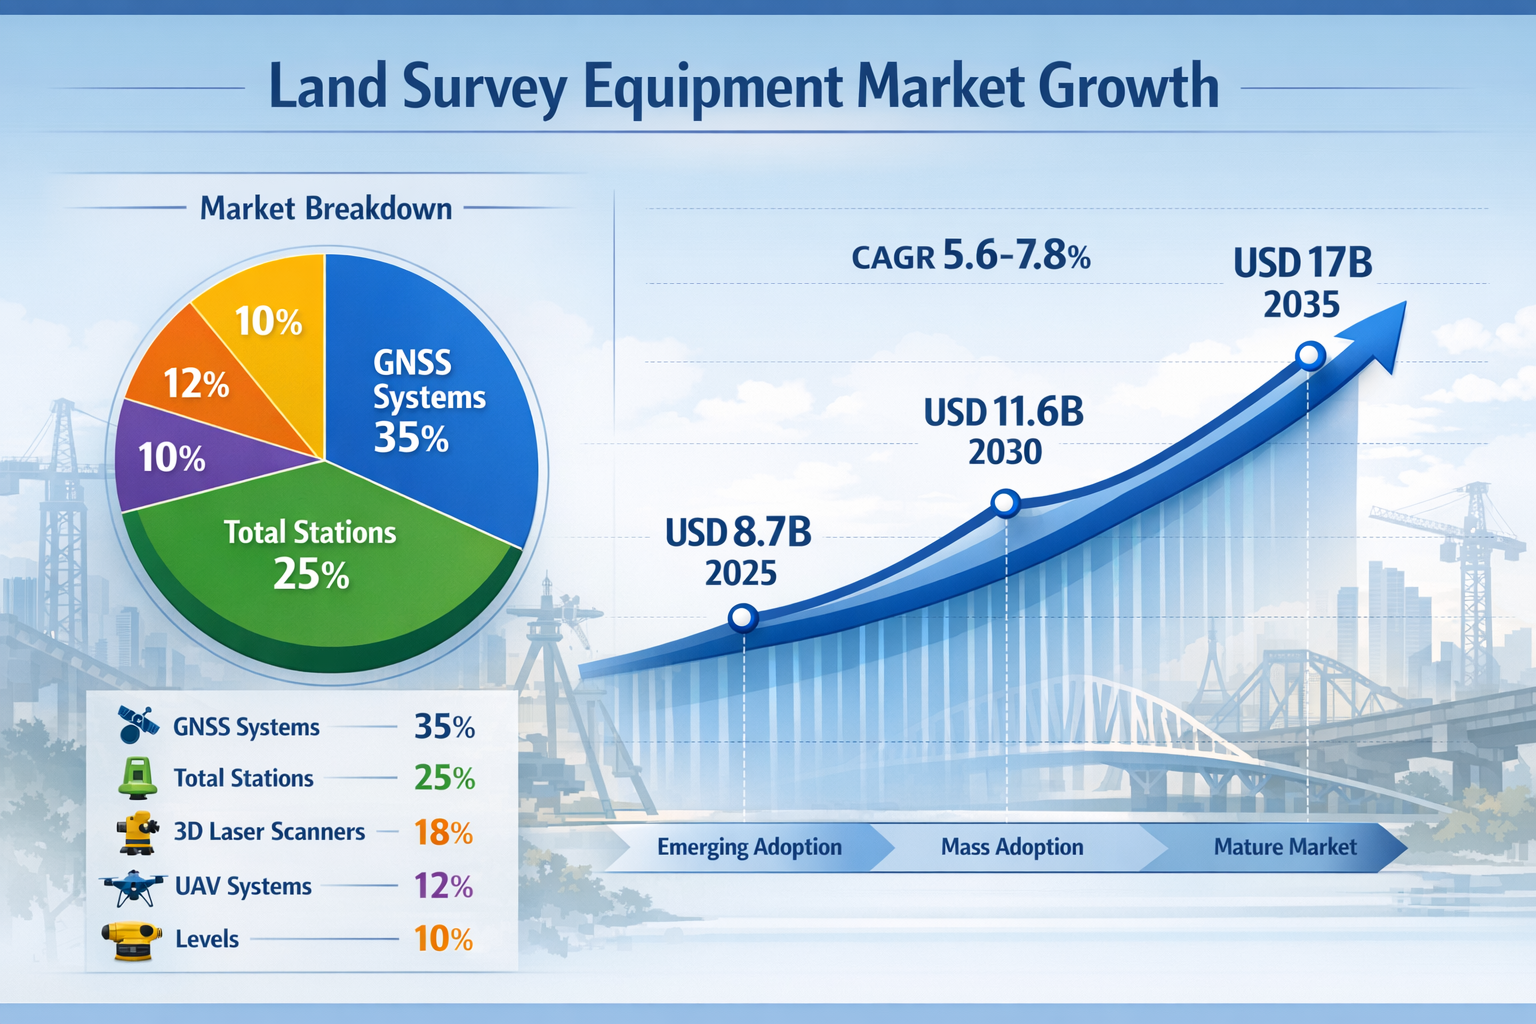
The surveying industry stands at a pivotal moment. As infrastructure projects multiply and precision demands intensify, the Land Survey Equipment Market Boom 2026: Investment Guide for Surveyors Facing USD 8.7 Billion Surge presents unprecedented opportunities for small-to-mid-sized surveying firms. With the global market expanding from USD 8.7 billion in 2025 to a projected USD 17 billion by 2035, understanding where to invest capital becomes critical for competitive survival and growth[1][4].
For surveying professionals navigating this expansion, the challenge isn't simply recognizing growth—it's making strategic equipment investments that deliver measurable returns. This comprehensive guide breaks down the forecasted market trajectory, examines top-performing equipment categories including total stations, GNSS RTK systems, and 3D laser scanners, and provides ROI calculations specifically tailored to firms operating with limited capital budgets.
Key Takeaways
- 📈 The land survey equipment market will grow from USD 8.7 billion (2025) to USD 17 billion (2035), representing a compound annual growth rate between 5.6% and 7.8% across different forecasting models[1][4]
- 🛰️ GNSS systems dominate market share with advanced positioning capabilities, while total stations, levels, 3D laser scanners, and UAV systems collectively maintain approximately 69% of market position[1]
- 🏗️ Construction sector drives 36% of total demand, with infrastructure development serving as the primary catalyst for equipment adoption acceleration[1]
- 💰 Small-to-mid surveying firms can achieve 12-36 month ROI on strategic equipment investments when properly matched to project portfolios and client demands
- 🚁 UAV integration represents the fastest-growing segment for 2030-2035, shifting from specialized applications to standard surveying practice across multiple industries[1]
Understanding the Land Survey Equipment Market Boom 2026: Growth Drivers and Market Dynamics
The USD 8.7 Billion Foundation: Current Market Landscape
The global land survey equipment market reached an estimated USD 9.22 to USD 10.72 billion in 2026, depending on source methodology and regional inclusion criteria[1][2][3]. This represents substantial growth from the USD 8.0 to USD 9.92 billion baseline established in 2025, indicating an industry experiencing accelerating momentum rather than incremental expansion[2][3].
Several interconnected factors drive this expansion:
Infrastructure Development Acceleration 🏗️
Governments worldwide have committed unprecedented capital to infrastructure modernization. From transportation networks to utility systems, these projects require precise measurement, boundary determination, and topographic mapping—core services that demand advanced surveying equipment. The construction segment alone commands approximately 36% of total market demand in 2025, with this percentage expected to increase through 2030[1].
Precision Measurement Requirements
Modern construction, engineering, and development projects operate with significantly tighter tolerance specifications than previous generations. What once required accuracy within centimeters now demands millimeter-level precision. This shift necessitates equipment upgrades across the surveying industry, creating replacement cycles independent of equipment failure or obsolescence.
Technology Integration Demands
Clients increasingly expect digital deliverables, real-time data sharing, and seamless integration with Building Information Modeling (BIM) and Computer-Aided Design (CAD) platforms. Legacy equipment lacking cloud connectivity, automated processing, or digital output capabilities faces functional obsolescence regardless of mechanical condition.
Multi-Industry Expansion
Beyond traditional construction applications, the market serves oil and gas, agriculture, mining, and disaster management sectors, each with distinct measurement and optimization requirements[1]. This diversification creates resilience against sector-specific downturns while expanding total addressable market size.
For firms considering equipment investments, understanding these drivers helps identify which technologies align with long-term market trends versus temporary demand fluctuations. Professional building surveyors increasingly rely on advanced equipment to meet client expectations for comprehensive property assessments.
The 2025-2035 Growth Trajectory: Two Distinct Phases
Market analysts characterize the decade-long expansion as occurring in two distinct phases, each with unique characteristics and investment implications:
Phase 1: Technology Adoption (2025-2030)
This initial period expands the market from approximately USD 8 billion to USD 11.6 billion, representing 40% of the decade's total projected growth[1]. Key characteristics include:
- Replacement of analog and early-digital equipment with advanced digital systems
- Integration of cloud connectivity and real-time data processing
- Adoption of GNSS systems as standard rather than specialized tools
- Initial UAV integration for specific high-value applications
- Gradual automation of data processing and analysis workflows
For small-to-mid surveying firms, this phase presents optimal investment timing. Equipment purchased during this period captures the majority of useful life within the high-growth environment while avoiding the premium pricing that often accompanies later-stage market maturity.
Phase 2: Advanced Automation Integration (2030-2035)
Growth accelerates from USD 11.6 billion to USD 17 billion, representing 60% of the expansion[1]. This phase features:
- Mass market UAV penetration shifting from specialized to standard applications
- AI-driven point cloud processing becoming industry standard
- Wearable augmented reality devices for field visualization
- Automated quality control and error detection systems
- Full integration with digital twin and smart city platforms
Firms that establish technological foundations during Phase 1 position themselves to adopt Phase 2 innovations incrementally rather than facing wholesale equipment replacement. This staged approach optimizes capital deployment and maintains competitive positioning throughout the expansion cycle.
Regional Variations and Market Concentration
While global figures provide useful benchmarks, regional variations significantly impact investment decisions for geographically-focused firms:
North America and Europe maintain technological leadership with highest adoption rates of advanced systems including 5G-enabled total stations, AI-driven processing software, and integrated UAV platforms[4]. These markets demonstrate willingness to pay premium pricing for cutting-edge capabilities, creating opportunities for firms serving high-value commercial and infrastructure clients.
Asia-Pacific represents the fastest-growing regional segment, driven by massive infrastructure development programs in India, Southeast Asia, and continued expansion in China. This region prioritizes cost-effectiveness and proven reliability over bleeding-edge innovation, favoring established equipment categories with strong track records.
Emerging Markets in Africa, Latin America, and parts of Asia demonstrate increasing adoption of mid-tier digital equipment, often leapfrogging intermediate technology generations entirely. These markets create opportunities for firms with equipment suitable for resale or deployment in cost-sensitive environments.
Understanding regional dynamics helps firms make strategic decisions about equipment specifications, feature sets, and price points that align with their target markets and client bases.
Equipment Category Analysis: Total Stations, GNSS Systems, and 3D Laser Scanners
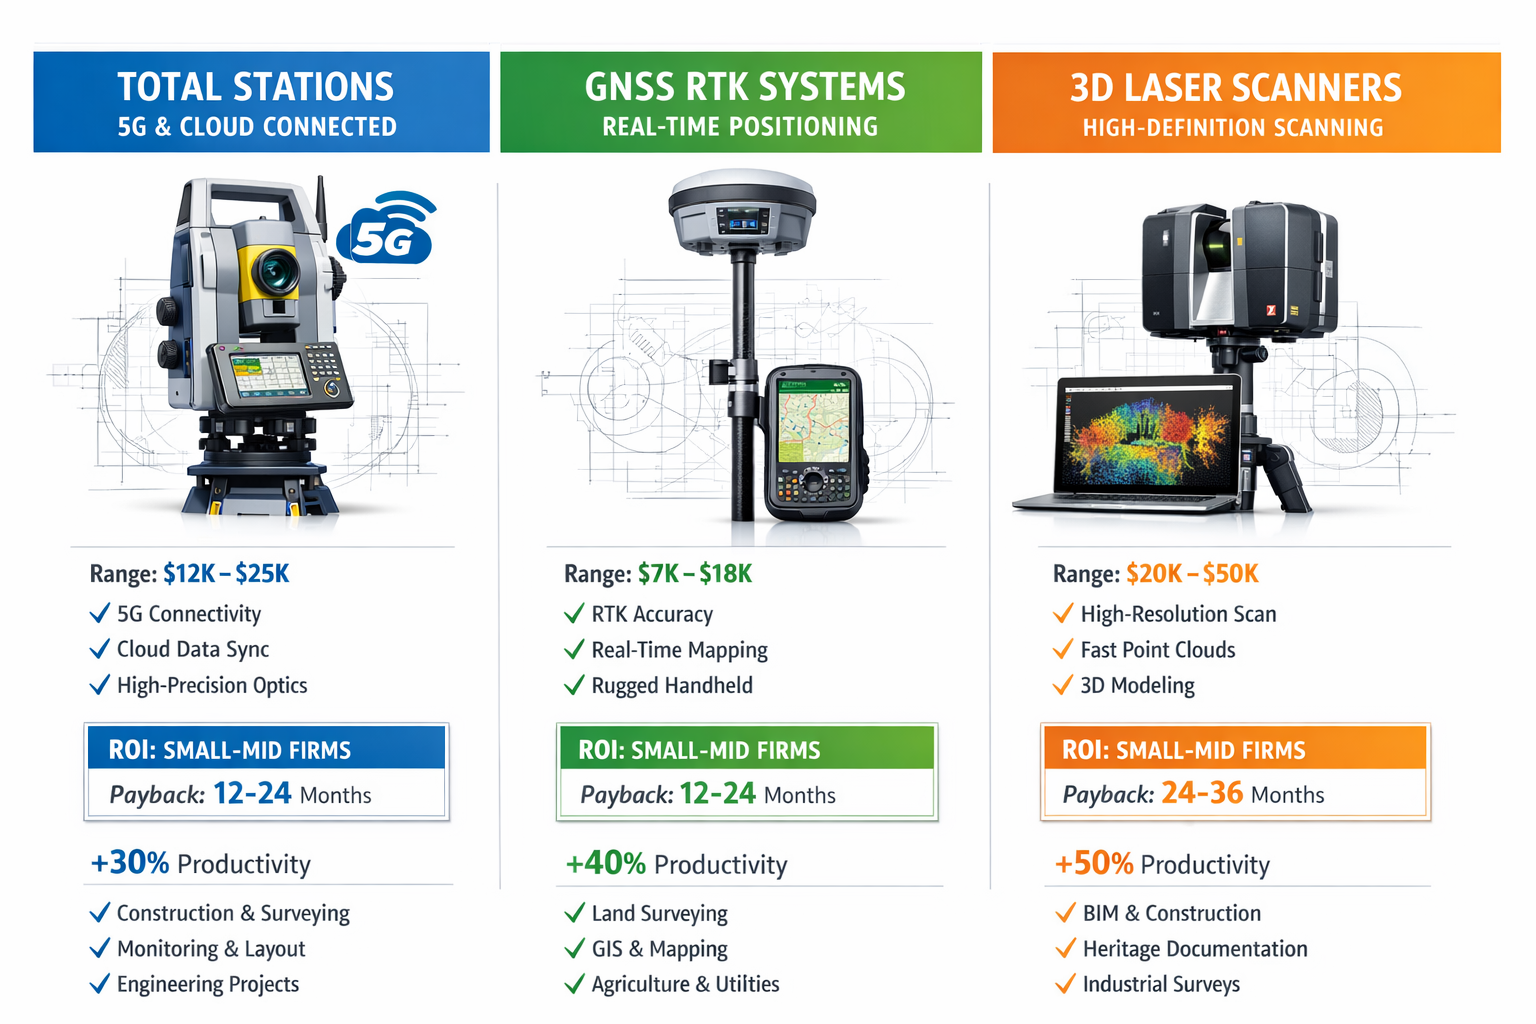
Total Stations: The Versatile Workhorse Evolves
Total stations represent the backbone of surveying operations for most small-to-mid-sized firms. These integrated instruments combine electronic theodolite capabilities with electronic distance measurement (EDM) technology, providing angle and distance measurements for coordinate determination.
Market Position and Technology Evolution
Total stations maintain significant market share within the broader equipment ecosystem, particularly for firms serving construction, civil engineering, and cadastral surveying markets[1]. Recent technological advancements have transformed these instruments from standalone devices into connected systems:
- 5G-enabled total stations with cloud connectivity allow real-time data synchronization with office systems, enabling immediate quality control and reducing field-to-finish timelines[4]
- Robotic total stations eliminate the need for two-person crews on many projects, dramatically improving labor efficiency
- Integrated imaging capabilities combine measurement data with visual documentation, enhancing deliverable quality and reducing site revisits
- Automated target recognition reduces measurement time and operator error while increasing point density
Investment Considerations for Small-to-Mid Firms
Total station investments typically range from USD 5,000 for entry-level manual instruments to USD 50,000+ for advanced robotic systems with full imaging and automation capabilities. For firms evaluating ROI:
| Equipment Tier | Price Range | Typical ROI Period | Best Applications |
|---|---|---|---|
| Entry-Level Manual | $5,000-$12,000 | 6-12 months | Boundary surveys, simple construction layout, cadastral work |
| Mid-Range Reflectorless | $12,000-$25,000 | 12-18 months | Construction staking, topographic surveys, as-built documentation |
| Advanced Robotic | $25,000-$40,000 | 18-30 months | Large construction projects, infrastructure work, one-person operations |
| Premium Imaging | $40,000-$60,000+ | 24-36 months | Complex industrial facilities, forensic documentation, high-value commercial |
ROI Calculation Example
Consider a mid-sized firm investing USD 28,000 in a robotic total station:
- Labor savings: Eliminates one crew member on 60% of projects = $35,000 annually
- Productivity increase: 25% more billable hours from faster measurements = $22,000 annually
- New project capabilities: Robotic functionality enables competitive bidding on larger projects = $15,000 annually
- Total annual benefit: $72,000
- Simple payback period: 4.7 months
- 3-year ROI: 671%
This calculation demonstrates why robotic total stations represent attractive investments for firms with sufficient project volume to justify the initial capital outlay. For detailed guidance on surveying best practices, explore our comprehensive guide to home surveying.
GNSS Systems: Dominant Technology Capturing Market Leadership
Global Navigation Satellite System (GNSS) equipment emerges as the leading technology type in the Land Survey Equipment Market Boom 2026: Investment Guide for Surveyors Facing USD 8.7 Billion Surge, capturing dominant market share through advanced positioning capabilities and measurement optimization[1].
Technology Fundamentals and Competitive Advantages
GNSS systems determine precise positions using satellite constellation signals from GPS (United States), GLONASS (Russia), Galileo (Europe), and BeiDou (China). Modern multi-constellation receivers provide:
- Centimeter-level accuracy in real-time kinematic (RTK) mode with base station or network corrections
- Rapid measurement collection compared to conventional total station methods for many applications
- Independence from line-of-sight requirements between measurement points (though requiring clear sky view)
- Seamless coordinate system integration with local, state, and national reference frameworks
RTK vs. PPK: Understanding the Investment Difference
Surveying firms face a fundamental decision between Real-Time Kinematic (RTK) and Post-Processed Kinematic (PPK) GNSS approaches:
RTK Systems provide immediate centimeter-accuracy positioning through real-time correction data from base stations or subscription networks. Benefits include:
- Instant verification of measurement quality
- Immediate stakeout capabilities
- Reduced post-processing time and complexity
- Higher equipment and subscription costs (USD 15,000-35,000+ for rover and base)
PPK Systems record raw satellite data for later processing with base station observations. Benefits include:
- Lower initial equipment costs (USD 8,000-20,000)
- No ongoing subscription fees for correction services
- Flexibility in correction source selection
- Delayed results requiring office processing
For most small-to-mid firms, RTK systems deliver superior ROI despite higher initial costs. The ability to verify measurements in real-time prevents costly site revisits, while immediate stakeout capabilities expand service offerings to construction layout and machine control applications.
Network RTK vs. Base-Rover Configurations
Firms must also choose between purchasing complete base-rover systems or subscribing to Network RTK (NRTK) correction services:
Base-Rover Systems (USD 25,000-45,000):
- ✅ No ongoing subscription fees
- ✅ Complete independence from network coverage
- ✅ Suitable for remote locations
- ❌ Requires base station setup time
- ❌ Limited range (typically 10-20km from base)
Network RTK Subscriptions (USD 800-2,500 annually):
- ✅ Immediate deployment with rover only
- ✅ Unlimited range within network coverage
- ✅ Lower initial equipment investment
- ❌ Ongoing operational expenses
- ❌ Dependency on network availability and reliability
Investment Recommendation: Firms operating primarily in urban and suburban areas with reliable NRTK coverage should invest in rover-only systems with network subscriptions (USD 12,000-20,000 for rover + USD 1,500 annual subscription). This approach minimizes capital requirements while maximizing operational flexibility.
Firms serving rural areas, remote infrastructure projects, or regions with limited network coverage require complete base-rover systems despite higher initial costs. The independence from network infrastructure becomes essential for reliable service delivery.
3D Laser Scanners: Capturing the High-Value Project Segment
Three-dimensional laser scanning technology has transitioned from specialized niche applications to mainstream surveying practice over the past decade. These instruments capture millions of measurement points per second, creating detailed "point clouds" representing physical environments with extraordinary precision.
Technology Categories and Applications
The 3D laser scanner market segments into distinct categories serving different applications:
Terrestrial Laser Scanners (TLS)
Tripod-mounted instruments suitable for:
- Industrial facility documentation and as-built surveys
- Historic preservation and architectural documentation
- Forensic and accident scene reconstruction
- Infrastructure condition assessment
- Price range: USD 25,000-150,000+
Mobile Laser Scanners (MLS)
Vehicle or backpack-mounted systems for:
- Roadway and corridor mapping
- Urban environment documentation
- Large-area topographic surveys
- Utility infrastructure mapping
- Price range: USD 75,000-300,000+
Handheld Laser Scanners
Portable instruments for:
- Interior building documentation
- Small-scale as-built surveys
- Quick-capture applications
- Price range: USD 15,000-50,000
ROI Considerations and Market Positioning
3D laser scanners represent significant capital investments requiring careful analysis of project pipeline and client demand. Key ROI factors include:
Project Premiums: Laser scanning projects typically command 20-40% premium pricing compared to conventional surveying methods, reflecting specialized expertise and equipment costs.
Efficiency Gains: Scanners capture comprehensive site data in 60-80% less field time than conventional methods, though post-processing requirements partially offset this advantage.
New Market Access: Scanner ownership enables competitive bidding on industrial, forensic, and high-value commercial projects often unavailable to firms with conventional equipment only.
Investment Analysis Example
Mid-sized firm investing USD 45,000 in terrestrial laser scanner:
- Premium project revenue: 8 scanning projects annually at $8,000 average = $64,000
- Conventional project displacement: Revenue replaces $40,000 in conventional surveys
- Net new revenue: $24,000 annually
- Efficiency savings: Reduced field time on conventional projects = $8,000 annually
- Total annual benefit: $32,000
- Simple payback period: 16.9 months
- 5-year ROI: 256%
This analysis demonstrates that laser scanners require longer payback periods than total stations or GNSS equipment, but deliver attractive returns for firms with appropriate project pipelines. The technology particularly benefits firms serving industrial, commercial, and infrastructure clients where comprehensive documentation justifies premium pricing.
For firms uncertain about sustained scanning demand, rental or project-specific subcontracting provides lower-risk alternatives to equipment purchase. Many equipment dealers offer rental rates of USD 800-1,500 per week, allowing firms to test market demand before committing capital.
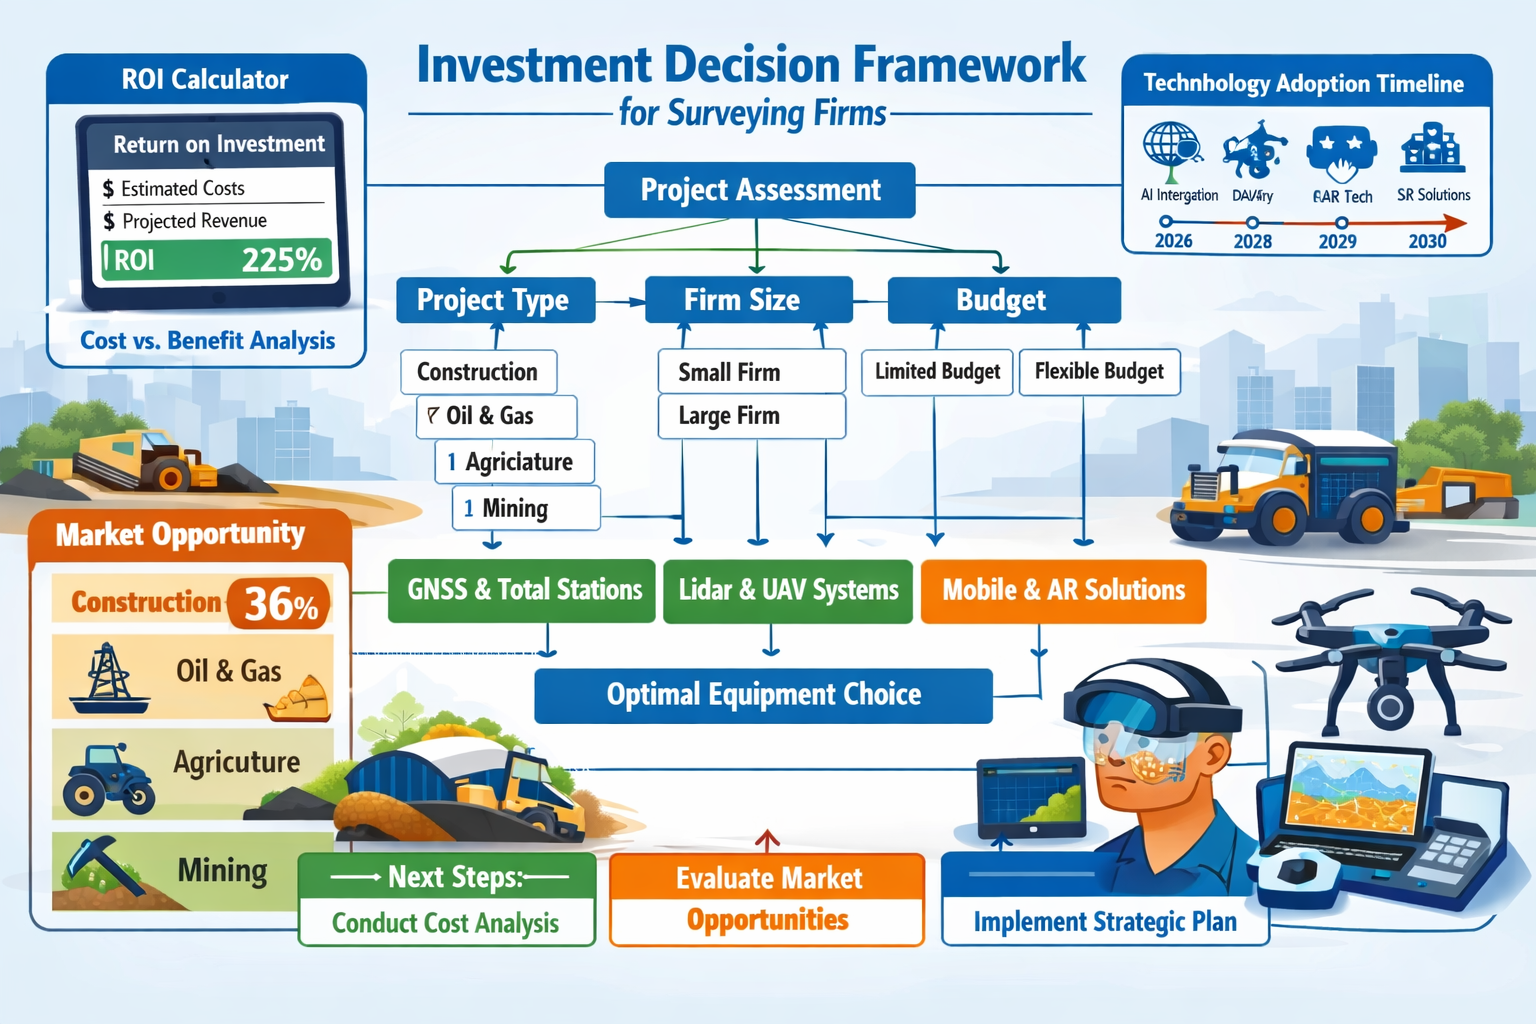
Strategic Investment Framework for Small-to-Mid Surveying Firms
Assessing Your Firm's Technology Position and Gaps
Before committing capital to new equipment purchases, firms must objectively assess their current technology position relative to market demands and competitive landscape. This assessment should address four critical dimensions:
1. Current Equipment Capabilities and Limitations 🔍
Create an inventory documenting:
- Equipment age and remaining useful life
- Technology generation (analog, early digital, modern digital, cutting-edge)
- Functional capabilities and limitations
- Maintenance costs and downtime frequency
- Compatibility with modern software and workflows
Equipment approaching 7-10 years of age typically warrants replacement consideration regardless of mechanical condition, as technological obsolescence increasingly limits competitive positioning and client satisfaction.
2. Project Portfolio Analysis
Examine your firm's project mix over the past 24 months:
- What percentage of projects could benefit from advanced equipment capabilities?
- Which projects were declined due to equipment limitations?
- What premium pricing could advanced capabilities command?
- Which client segments show strongest growth potential?
This analysis often reveals that 20-30% of project portfolio could generate significantly higher margins with appropriate equipment investments, while another 10-15% of potential projects go unbid due to capability gaps.
3. Competitive Landscape Assessment
Understand competitor positioning in your market:
- What equipment capabilities do primary competitors possess?
- Which firms are winning projects you're losing, and why?
- What technology investments have competitors announced?
- Which capability gaps create competitive vulnerabilities?
Markets with aggressive competitor technology adoption require defensive investments to maintain market position, while markets with limited competitor capabilities present opportunities for differentiation through technology leadership.
4. Client Expectations and Future Requirements
Survey key clients regarding:
- Current satisfaction with deliverable formats and turnaround times
- Emerging requirements for digital integration and BIM compatibility
- Willingness to pay premium pricing for advanced capabilities
- Future project plans and technology expectations
Client feedback often reveals capability gaps before they manifest in lost projects, enabling proactive rather than reactive equipment investments. Understanding topographic survey requirements helps firms align equipment capabilities with market demands.
Building a Phased Investment Roadmap (2026-2030)
Rather than attempting comprehensive equipment modernization through single large capital commitments, successful firms develop phased investment roadmaps aligned with business growth, market evolution, and cash flow realities.
Year 1 (2026): Foundation Technology 💼
Priority: Establish core capabilities enabling competitive participation in primary market segments
Recommended Investments:
- Mid-range robotic total station (USD 28,000-35,000) providing labor efficiency and expanded project capabilities
- GNSS rover with network RTK subscription (USD 15,000 equipment + USD 1,500 annual subscription) enabling rapid data collection and construction layout services
- Modern data collector and field software (USD 3,000-5,000) ensuring seamless integration and efficient workflows
Total Year 1 Investment: USD 46,000-55,500
Expected Year 1 ROI Impact: 15-25% revenue increase through efficiency gains and capability expansion
Year 2 (2027): Specialization and Differentiation
Priority: Add capabilities enabling premium pricing and market differentiation
Recommended Investments:
- Entry-level 3D laser scanner (USD 25,000-35,000) for industrial and commercial project access
- UAV platform with photogrammetry capabilities (USD 8,000-15,000) for aerial mapping and inspection services
- Advanced office processing software (USD 5,000-8,000) for point cloud processing and automated deliverable generation
Total Year 2 Investment: USD 38,000-58,000
Expected Year 2 ROI Impact: Additional 10-15% revenue increase through new service offerings
Year 3 (2028): Automation and Integration
Priority: Maximize efficiency through workflow automation and system integration
Recommended Investments:
- GNSS base station (USD 12,000-18,000) eliminating network subscription costs and enabling remote project work
- Machine control integration capabilities (USD 8,000-12,000) expanding construction services into higher-margin automated grading
- Cloud-based project management platform (USD 3,000-5,000 annually) enabling real-time client collaboration
Total Year 3 Investment: USD 23,000-35,000
Expected Year 3 ROI Impact: Additional 8-12% revenue increase plus operational cost reduction
Year 4-5 (2029-2030): Advanced Capabilities
Priority: Position for Phase 2 market evolution (2030-2035)
Recommended Investments:
- Advanced imaging total station (USD 45,000-60,000) replacing original robotic unit
- Mobile laser scanning system (USD 75,000-120,000) for corridor and large-area projects
- AI-driven processing automation (USD 8,000-15,000) reducing office processing time and costs
This phased approach distributes capital requirements across multiple years while building capabilities incrementally. Firms following this roadmap position themselves within the top quartile of technology adoption, capturing premium market segments while maintaining financial stability.
Financing Options and Capital Structure Considerations
Equipment investments ranging from USD 150,000-300,000 over five years require careful consideration of financing approaches and capital structure implications.
Cash Purchase Advantages 💵
- No interest costs or financing fees
- Immediate ownership and depreciation benefits
- Maximum negotiating leverage with equipment dealers
- Simplified accounting and asset management
Recommended for: Firms with strong cash positions and conservative growth strategies
Equipment Financing Advantages
- Preserves working capital for operations and growth
- Matches payment obligations with revenue generation
- Potential tax advantages through interest deductions
- Typical terms: 3-5 years at 4-8% interest rates
Recommended for: Firms prioritizing growth and operational flexibility over balance sheet optimization
Operating Lease Advantages
- Lowest monthly payments (typically 30-40% below financing)
- Technology refresh options at lease end
- Off-balance-sheet treatment (depending on accounting standards)
- Maintenance and support often included
Recommended for: Firms in rapidly evolving technology segments or uncertain about long-term equipment needs
Hybrid Approach Recommendation
Many successful firms employ a hybrid financing strategy:
- Cash purchase core equipment with long useful lives (total stations, GNSS bases)
- Equipment financing for mid-tier investments with clear ROI (robotic systems, rovers)
- Operating leases for rapidly evolving technology (scanners, UAVs, processing software)
This approach optimizes capital efficiency while maintaining financial flexibility and technology currency.
Operational Excellence: Maximizing ROI Through Effective Implementation
Training and Skill Development Requirements
Equipment investments deliver projected ROI only when coupled with comprehensive training ensuring operators maximize capabilities and efficiency. Many firms underestimate training requirements, leading to underutilization of advanced features and delayed ROI realization.
Manufacturer Training Programs 📚
Most equipment manufacturers offer tiered training programs:
Basic Operation (1-2 days, often included with purchase):
- Fundamental instrument setup and operation
- Basic measurement procedures
- Data collection and transfer
- Routine maintenance and troubleshooting
Advanced Applications (2-3 days, USD 500-1,500 per person):
- Specialized measurement techniques
- Advanced software functionality
- Workflow optimization
- Quality control procedures
Expert Certification (3-5 days, USD 1,500-3,000 per person):
- Complex project applications
- Custom programming and automation
- System integration and customization
- Instructor-level proficiency
Training Investment Recommendation
Firms should budget 8-12% of equipment purchase price for comprehensive training ensuring maximum capability utilization. For a USD 50,000 equipment investment, this represents USD 4,000-6,000 in training costs.
Internal Knowledge Transfer
Beyond manufacturer training, establish internal processes ensuring knowledge distribution across the team:
- Document standard operating procedures for each equipment type
- Create internal training videos for common workflows
- Implement mentorship pairing experienced operators with newer staff
- Schedule quarterly technology review sessions sharing tips and techniques
Firms that invest appropriately in training typically achieve 25-40% faster ROI realization compared to those relying solely on basic manufacturer instruction.
Workflow Integration and Process Optimization
New equipment delivers maximum value when integrated into optimized workflows rather than simply replacing legacy tools in existing processes. Many firms miss significant efficiency gains by maintaining outdated procedures despite advanced equipment capabilities.
Field-to-Finish Workflow Design
Modern surveying equipment enables field-to-finish workflows where raw field measurements transform directly into final deliverables with minimal manual intervention:
Traditional Workflow (Legacy Approach):
- Field crew collects measurements → manual data entry
- Office technician downloads and processes data → manual quality control
- CAD operator creates drawings → manual checking
- Project manager reviews and revises → client delivery
Timeline: 5-7 days for typical project
Optimized Field-to-Finish Workflow:
- Field crew collects measurements with real-time coding → automated quality control
- Cloud synchronization transfers data automatically → automated processing
- Software generates preliminary deliverables → automated quality checks
- Surveyor reviews and finalizes → immediate client delivery
Timeline: 1-2 days for typical project
This workflow transformation reduces project turnaround by 60-70% while improving quality through automated error detection and consistency checks.
Technology Integration Requirements
Achieving field-to-finish efficiency requires:
- Standardized coding libraries ensuring consistent feature classification
- Template-based processing automating repetitive tasks
- Cloud infrastructure enabling real-time data synchronization
- Integrated software platforms eliminating manual data transfers between applications
Firms should allocate 20-30 hours for workflow design and optimization when implementing new equipment, treating this as essential rather than optional investment.
Maintenance, Calibration, and Asset Management
Advanced surveying equipment requires systematic maintenance and calibration ensuring measurement accuracy and reliability. Equipment failures during critical project phases create cascading delays, client dissatisfaction, and revenue losses far exceeding maintenance costs.
Preventive Maintenance Schedules 🔧
Establish routine maintenance schedules for each equipment category:
Daily (Field Crew Responsibility):
- Visual inspection for physical damage
- Lens and prism cleaning
- Battery charging and management
- Protective case and transportation inspection
Monthly (Office Responsibility):
- Firmware and software updates
- Backup and archive field data
- Accessory inventory and condition check
- Documentation of any performance issues
Quarterly (Technician Responsibility):
- Comprehensive functional testing
- Calibration verification
- Cleaning and lubrication
- Warranty and service contract review
Annual (Manufacturer Service):
- Factory-level calibration and certification
- Comprehensive performance testing
- Preventive parts replacement
- Firmware optimization and updates
Maintenance Cost Budgeting
Plan for annual maintenance costs representing 3-5% of equipment purchase price:
- USD 30,000 total station: USD 900-1,500 annual maintenance
- USD 20,000 GNSS rover: USD 600-1,000 annual maintenance
- USD 40,000 laser scanner: USD 1,200-2,000 annual maintenance
These costs prove far more economical than emergency repairs, equipment replacement, or project delays resulting from inadequate maintenance.
Asset Management and Depreciation
Implement formal asset management tracking:
- Equipment utilization rates and billable hours
- Maintenance history and costs
- Calibration certificates and compliance documentation
- Depreciation schedules and replacement planning
Most surveying equipment maintains useful life of 7-10 years with proper maintenance, though technological obsolescence often drives replacement before mechanical failure. Plan equipment replacement cycles based on 5-7 year horizons for core instruments, ensuring technology currency while maximizing capital efficiency.
For firms managing multiple properties or complex projects, professional property surveyors provide essential expertise in equipment selection and utilization strategies.
Future-Proofing Your Investment: Emerging Technologies and Market Trends
UAV Integration: From Specialized to Standard Practice
Unmanned aerial vehicle (UAV) integration represents the primary growth driver for the 2030-2035 period, with mass market penetration expected to shift UAVs from specialized to standard applications[1]. Small-to-mid surveying firms face strategic decisions about timing and scope of UAV adoption.
Current UAV Applications in Surveying
UAV technology currently serves several distinct surveying applications:
Photogrammetry and Orthomosaic Generation:
- Large-area topographic mapping
- Construction progress documentation
- Stockpile volume calculations
- Agricultural field analysis
- Investment range: USD 3,000-15,000 for capable platforms
LiDAR Scanning:
- Corridor and linear infrastructure mapping
- Forestry and vegetation analysis
- Flood plain and watershed modeling
- Urban environment documentation
- Investment range: USD 50,000-150,000 for integrated systems
Inspection and Documentation:
- Building facade and roof inspection
- Infrastructure condition assessment
- Cell tower and utility structure examination
- Environmental monitoring
- Investment range: USD 2,000-8,000 for specialized platforms
Investment Timing Recommendations
For most small-to-mid firms, 2026-2027 represents optimal timing for initial UAV investment:
✅ Invest Now If:
- Serving construction, mining, or aggregate clients requiring volume calculations
- Operating in competitive markets where UAV capabilities provide differentiation
- Project pipeline includes large-area topographic mapping requirements
- Firm has staff interested in developing UAV specialization
⏸️ Delay Investment If:
- Current project mix shows limited UAV application opportunities
- Regulatory environment in operating region remains uncertain
- Staff capacity for training and certification development is limited
- Capital priorities favor other equipment categories with clearer ROI
Regulatory Compliance Requirements
UAV operations require compliance with aviation regulations varying by jurisdiction. In most regions, commercial surveying applications require:
- Remote pilot certification (USD 150-500 for testing and preparation)
- Aircraft registration and marking
- Operational insurance coverage (USD 1,000-3,000 annually)
- Compliance with airspace restrictions and notification requirements
Budget USD 2,000-4,000 for initial regulatory compliance beyond aircraft purchase costs.
Artificial Intelligence and Automated Processing
AI-driven point cloud processing software emerges as a transformative technology reducing office processing time while improving deliverable quality and consistency[4]. These systems apply machine learning algorithms to automate tasks traditionally requiring extensive manual effort.
Current AI Applications
- Automated feature extraction: Identifying and classifying objects within point clouds (buildings, vegetation, utilities, terrain)
- Quality control and error detection: Flagging measurement anomalies, registration errors, and data gaps
- Deliverable generation: Automatically creating CAD drawings, 3D models, and analysis products
- Change detection: Comparing multi-temporal datasets identifying modifications and deformations
Investment Considerations
AI processing software typically operates on subscription models (USD 3,000-12,000 annually) rather than perpetual licenses, creating ongoing operational expenses balanced against labor cost reduction.
ROI Analysis Example:
- Software subscription: USD 6,000 annually
- Processing time reduction: 40% decrease in office processing labor = USD 25,000 annually
- Quality improvement: Reduced revision requests and client complaints = USD 5,000 annually
- Net annual benefit: USD 24,000
- ROI: 300%
For firms conducting significant laser scanning or photogrammetry work, AI processing software delivers compelling returns. Firms with limited point cloud processing should delay investment until project volume justifies subscription costs.
Wearable Technology and Augmented Reality
Wearable augmented reality (AR) devices for field visualization represent emerging technology transitioning from experimental to practical application[4]. These systems overlay digital design information onto physical environments, enabling:
- Construction layout verification: Comparing as-built conditions against design intent in real-time
- Utility location and marking: Visualizing subsurface infrastructure before excavation
- Design review and stakeholder communication: Enabling clients to visualize proposed improvements in context
- Quality control and inspection: Identifying deviations from specifications during construction
Current Market Maturity
AR technology for surveying applications remains in early adoption phase (2026), with limited standardization, high equipment costs (USD 3,000-8,000 per device), and developing software ecosystems.
Investment Recommendation: Most small-to-mid firms should monitor but delay investment in AR technology until 2028-2029, when market maturity will deliver improved functionality, reduced costs, and established workflows. Early adopters serving innovative clients in technology-forward markets may find competitive advantage in earlier adoption despite higher costs and implementation challenges.
Conclusion: Navigating the Land Survey Equipment Market Boom 2026 with Strategic Confidence
The Land Survey Equipment Market Boom 2026: Investment Guide for Surveyors Facing USD 8.7 Billion Surge presents extraordinary opportunities for small-to-mid-sized surveying firms willing to make strategic equipment investments aligned with market evolution and client demands. With the global market expanding from USD 8.7 billion in 2025 to USD 17 billion by 2035, firms that position themselves within the technology adoption curve capture premium market segments while competitors struggle with legacy capabilities[1][4].
Success requires moving beyond reactive equipment replacement toward proactive technology roadmapping that anticipates client needs, competitive pressures, and market evolution. The phased investment framework presented in this guide—prioritizing foundation technologies in 2026-2027, specialization capabilities in 2028-2029, and automation integration in 2030—provides a proven pathway for sustainable growth without excessive financial risk.
Actionable Next Steps for Surveying Firm Leaders
Immediate Actions (Next 30 Days) 📋:
- Conduct comprehensive equipment inventory documenting current capabilities, limitations, and replacement timelines
- Analyze project portfolio identifying capability gaps, declined opportunities, and premium pricing potential
- Survey key clients regarding technology expectations, deliverable requirements, and future project plans
- Research equipment options for priority categories identified through portfolio analysis
- Develop preliminary investment budget for 2026-2027 aligned with business growth objectives
Short-Term Planning (Next 90 Days):
- Obtain equipment demonstrations from multiple manufacturers for priority categories
- Develop detailed ROI calculations for specific equipment investments under consideration
- Explore financing options comparing cash purchase, equipment financing, and operating lease alternatives
- Create training plan ensuring staff development matches equipment capabilities
- Design optimized workflows integrating new equipment into field-to-finish processes
Long-Term Strategy (Next 12 Months):
- Implement Year 1 equipment investments following phased roadmap approach
- Establish maintenance and calibration schedules protecting equipment investments
- Monitor market evolution adjusting investment roadmap based on technology developments and competitive dynamics
- Measure and document ROI from initial investments, refining future investment decisions
- Develop technology leadership positioning in marketing and client communications
The surveying industry stands at a pivotal moment where technology investments separate market leaders from followers. Firms that approach the Land Survey Equipment Market Boom 2026: Investment Guide for Surveyors Facing USD 8.7 Billion Surge with strategic discipline, financial prudence, and commitment to operational excellence position themselves for sustained growth and competitive advantage throughout the coming decade.
For additional guidance on surveying best practices and professional standards, explore resources on verifying surveyor credentials and understanding different survey types to ensure your firm maintains the highest professional standards alongside technological advancement.
The market opportunity is clear. The investment framework is proven. The time for strategic action is now.
References
[1] Land Survey Equipment Market – https://www.futuremarketinsights.com/reports/land-survey-equipment-market
[2] Navigating The 2026 Land Survey Equipment Boom Total Stations Gps And Laser Scanners Reviewed – https://nottinghillsurveyors.com/blog/navigating-the-2026-land-survey-equipment-boom-total-stations-gps-and-laser-scanners-reviewed
[3] Land Survey Equipment Market 103329 – https://www.fortunebusinessinsights.com/infographics/land-survey-equipment-market-103329
[4] Land Survey Equipment Market Global Forecast – https://www.researchandmarkets.com/reports/5716131/land-survey-equipment-market-global-forecast
[5] Land Survey Equipment Global Market Report – https://www.thebusinessresearchcompany.com/report/land-survey-equipment-global-market-report