
The UK property market has entered an unprecedented era of regional divergence. As Northern England experiences remarkable price surges while Southern markets stagnate, chartered surveyors face a critical challenge: how do you accurately value properties when traditional assumptions no longer hold? Understanding Valuation Techniques for Northern England vs Southern Stagnation: Surveyor Tools for 2026 Regional Price Gaps has become essential for professionals navigating this transformed landscape.
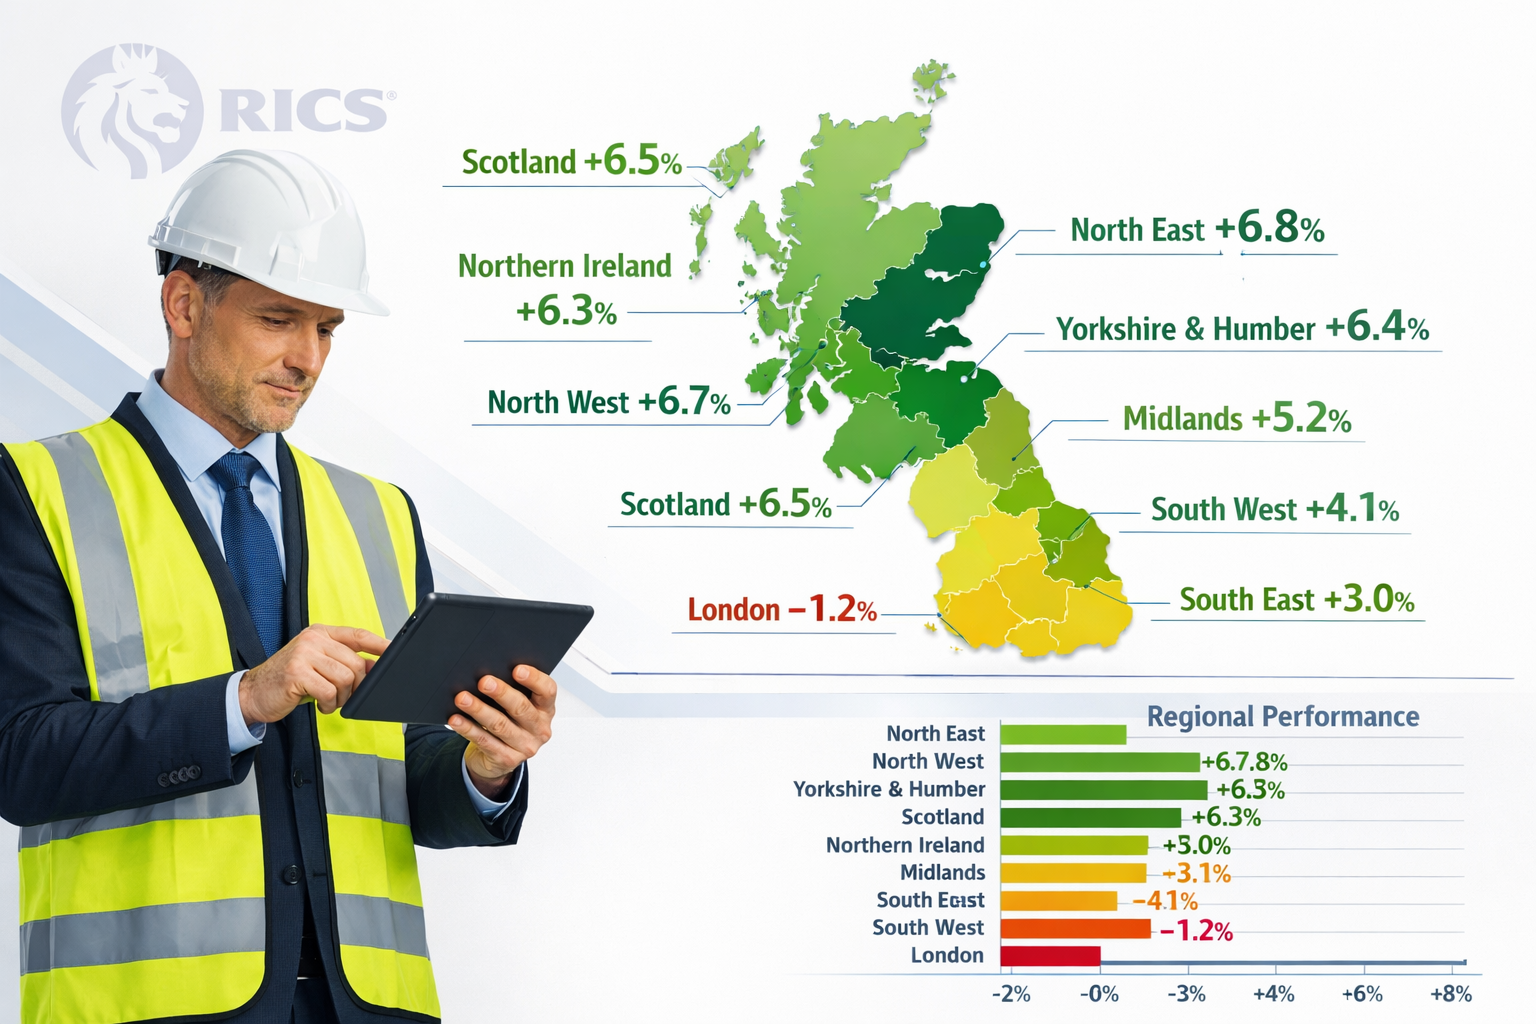
The numbers tell a striking story. The North East region is posting 6.8% annual price growth as of early 2026, while London properties decline at -1.2% annually[1]. This isn't a temporary blip—it represents a fundamental shift in regional property dynamics that demands sophisticated valuation approaches and carefully calibrated adjustment techniques.
Key Takeaways
- 📈 Northern England is experiencing 6-7% price increases while London faces -1.2% annual declines, creating the widest regional valuation gap in decades
- 🔍 Comparative market analysis remains the primary valuation method, but regional adjustment factors must be recalibrated for 2026's divergent markets
- 📊 RICS data from February 2026 shows London at -40% net balance, indicating severe negative surveyor sentiment requiring conservative valuation approaches
- 💼 Mortgage valuations typically come in lower than market valuations, a gap that widens significantly in volatile regional markets
- 🎯 Surveyors must employ location-specific adjustment techniques that account for regional momentum, sentiment shifts, and local economic drivers
Understanding the 2026 Regional Property Divide
The Northern England Surge
Northern England has transformed from a historically undervalued market into the UK's growth engine. Key locations across the North are seeing 6-7% price increases[2], driven by multiple converging factors:
Economic drivers include:
- Remote work flexibility enabling London exodus
- Infrastructure investment in Northern cities
- Relative affordability attracting first-time buyers
- Strong rental yields supporting buy-to-let investment
- Regional regeneration projects boosting local economies
The North East leads this charge with 6.8% annual growth[1], but the momentum extends across Yorkshire, Lancashire, and Greater Manchester. For chartered surveyors working in these regions, this presents both opportunity and complexity.
The Southern Stagnation Reality
Contrast this with Southern England's struggles. London properties are declining at -1.2% annually[1], while RICS data from February 2026 reveals a -40% net balance for London properties[3]—one of the most negative surveyor sentiment readings on record.
Factors driving Southern stagnation:
- Affordability crisis limiting buyer pool
- High stamp duty burden on premium properties
- Economic uncertainty affecting financial services sector
- Oversupply in certain segments (particularly new-build flats)
- Changing work patterns reducing London premium
This divergence isn't merely academic—it fundamentally changes how surveyors must approach valuations across different regions.
Core Valuation Techniques for Northern England vs Southern Stagnation: Surveyor Tools for 2026 Regional Price Gaps
Comparative Market Analysis: The Foundation
Comparative market analysis (CMA) remains the primary method for residential valuations[4]. Valuers identify similar properties sold in the same neighbourhood within 3-6 months, then adjust for differences in:
- Property size and layout
- Condition and modernization
- Location quality within neighbourhood
- Market timing and seasonal factors
- Unique features or deficiencies
However, the 3-6 month comparable window becomes problematic in rapidly changing markets. In Northern growth regions, comparables from six months ago may significantly undervalue current market conditions. Conversely, in stagnant Southern markets, recent sales may not reflect declining sentiment.

Regional Adjustment Factors: The Critical Difference
Surveyors employ specific adjustment methods to account for location premiums and regional market sentiment shifts[1]. These adjustments vary significantly between Northern growth markets and Southern stagnant areas.
Northern England adjustment considerations:
| Adjustment Factor | Typical Range | Application |
|---|---|---|
| Regional momentum premium | +2% to +5% | Applied to reflect sustained growth trajectory |
| Infrastructure improvement | +1% to +3% | For areas benefiting from transport/regeneration |
| Relative value positioning | +3% to +7% | Compared to historical North-South differentials |
| Buyer demand intensity | +1% to +4% | Based on time-to-sale and offer competition |
Southern England adjustment considerations:
| Adjustment Factor | Typical Range | Application |
|---|---|---|
| Market sentiment discount | -2% to -5% | Reflecting negative RICS balance readings |
| Affordability constraint | -3% to -6% | For properties exceeding local income multiples |
| Oversupply correction | -2% to -4% | In segments with high inventory levels |
| Economic uncertainty buffer | -1% to -3% | Conservative positioning for lender protection |
Understanding what chartered surveyors do in applying these adjustments requires both technical expertise and local market knowledge.
The Three Valuation Types and Regional Implications
Three primary valuation types serve distinct purposes[4], and regional market conditions affect each differently:
1. Market Valuations
Market valuations estimate the price a willing buyer would pay a willing seller in current conditions. In Northern growth markets, these tend to be optimistic, reflecting strong buyer demand. In Southern stagnant markets, they must account for extended marketing periods and potential price reductions.
2. Mortgage Valuations
Mortgage valuations typically come in lower than market valuations[4] because lenders adopt conservative assumptions to protect against default risk. This conservative approach becomes even more pronounced in volatile markets.
In Southern stagnant regions, the gap between market and mortgage valuations widens significantly. A property marketed at £500,000 in London might receive a mortgage valuation of £475,000, creating financing challenges for buyers with limited deposits.
Conversely, in Northern growth markets, mortgage valuers must balance conservatism against the risk of undervaluing in a rising market—potentially requiring buyers to contribute larger deposits despite properties genuinely being worth the purchase price.
Understanding the cost of valuation services helps clients budget appropriately for these essential assessments.
3. Tax Valuations
Tax valuations determine inheritance tax and capital gains tax liability. Regional market conditions significantly affect these calculations, particularly for estate planning purposes. Properties in Northern growth regions may see substantial appreciation, increasing tax exposure, while Southern properties may face more modest or even negative capital gains.
Advanced Surveyor Tools for Valuation Techniques for Northern England vs Southern Stagnation: Surveyor Tools for 2026 Regional Price Gaps
Data-Driven Valuation Platforms
Modern surveyors leverage sophisticated technology platforms that aggregate transaction data, market trends, and economic indicators. These tools become essential when valuation accuracy depends on comprehensive, up-to-date transaction records[4].
Key platform capabilities include:
- 🔍 Real-time comparable sales databases with regional filtering
- 📊 Automated valuation models (AVMs) with regional calibration
- 📈 Price trend analysis showing momentum and trajectory
- 🗺️ Heat mapping of micro-market performance within regions
- 💡 Predictive analytics for forward-looking valuations
However, technology cannot replace professional judgment. Surveyors must critically evaluate algorithmic outputs, particularly in markets experiencing rapid change where historical patterns may not predict future performance.

Income Approach for Investment Properties
Buy-to-let yield assessment requires calculating annual rent as a percentage of valuation figures[4]. Regional differences in rental markets significantly affect these calculations:
Northern England rental dynamics:
- Strong rental demand from young professionals
- Yields typically 5-7% in growth cities
- Lower void periods (average 2-3 weeks)
- Tenant demand supporting rent increases
Southern England rental dynamics:
- Saturated rental markets in some segments
- Yields typically 3-4% in prime London areas
- Higher void periods (average 4-6 weeks)
- Rent growth stagnant or declining
For investors, the income approach helps assess whether returns justify purchase prices given mortgage costs, maintenance, and void periods. A property in Manchester yielding 6.5% presents a fundamentally different investment proposition than a London property yielding 3.2%, even if both have similar purchase prices.
Cost Approach for Unique Properties
The cost approach calculates property value based on land value plus construction costs minus depreciation. This method proves particularly valuable for:
- Newly constructed properties without comparable sales
- Unique properties with few market comparables
- Properties in emerging Northern markets lacking transaction history
- Development site valuations
In Northern growth markets, the cost approach helps identify undervalued properties where renovation or repositioning could unlock significant capital appreciation[4]—particularly relevant given current North-South divergence.
Practical Application: Regional Valuation Scenarios
Scenario 1: Terraced House in Newcastle
Property details:
- 3-bedroom Victorian terraced house
- Recently renovated
- Popular residential area
- Purchase price: £225,000
Valuation approach:
- Identify 5-8 comparable sales within 0.5 miles from past 3 months
- Apply +3% regional momentum adjustment (North East 6.8% growth trajectory)
- Add +2% for superior renovation quality vs. comparables
- Consider +1% for location within catchment of outstanding school
Resulting valuation range: £230,000-£235,000
The surveyor must document these adjustments clearly, particularly for mortgage lenders who may question valuations exceeding purchase price in growth markets. Comprehensive structural survey reports support these valuations by confirming property condition.
Scenario 2: Flat in Central London
Property details:
- 2-bedroom apartment in new-build development
- 10th floor with river views
- Completed 2024
- Purchase price: £650,000
Valuation approach:
- Identify comparable sales in same development and similar schemes
- Apply -4% market sentiment discount (London -40% RICS net balance)
- Apply -2% oversupply adjustment (high inventory of similar new-builds)
- Consider extended marketing period (average 6 months vs. 3 months historical)
Resulting valuation range: £605,000-£615,000
This scenario illustrates the mortgage valuation gap—the property may struggle to achieve a valuation supporting the £650,000 purchase price, potentially requiring the buyer to increase their deposit or renegotiate the purchase price.
Challenges and Limitations in Regional Valuation
Data Availability and Quality
Regional markets vary significantly in transaction volume and data transparency. Northern markets, while growing, may have fewer comparable sales in specific micro-locations, forcing surveyors to widen their search radius or timeframe—both of which reduce accuracy.
Southern markets typically offer abundant data, but in stagnant conditions, this data may reflect asking prices rather than achieved prices, skewing valuations upward.
Sentiment vs. Reality
RICS sentiment data (like the -40% London net balance) reflects surveyor expectations rather than completed transactions. While valuable, sentiment can become self-fulfilling—negative expectations may drive conservative valuations, which in turn suppress prices, validating the initial pessimism.
Surveyors must balance data-driven analysis with professional skepticism about whether current sentiment accurately predicts medium-term market direction.
Timing and Market Cycles
Property markets operate in cycles, and regional cycles increasingly operate out of sync. Northern growth may represent:
- Early-stage appreciation with years of growth ahead
- Mid-cycle expansion approaching peak
- Temporary momentum before correction
Similarly, Southern stagnation could indicate:
- Temporary pause before renewed growth
- Extended plateau lasting several years
- Early stage of sustained decline
Distinguishing between these scenarios requires deep regional economic analysis beyond pure comparable sales data. Resources like surveyor qualification verification guides help clients select professionals with appropriate regional expertise.
Best Practices for Surveyors in 2026
1. Maintain Regional Specialization
The divergence between Northern and Southern markets makes regional specialization increasingly valuable. Surveyors should develop deep expertise in specific regions rather than attempting national coverage, understanding:
- Local economic drivers and employment trends
- Infrastructure development pipelines
- Planning policy and development constraints
- Micro-market variations within broader regions
- Historical price cycles and patterns
2. Update Comparable Sales Databases Continuously
In rapidly changing markets, quarterly or even monthly database updates become essential. Surveyors should:
- Subscribe to multiple data sources for cross-verification
- Maintain personal records of local transactions
- Network with estate agents for pre-market intelligence
- Monitor planning applications for supply pipeline
3. Document Adjustment Rationale Thoroughly
With wider regional valuation gaps, comprehensive documentation protects surveyors from challenge. Every adjustment should include:
- Clear explanation of adjustment factor
- Supporting data or market evidence
- Comparison to regional norms
- Sensitivity analysis showing valuation range
This documentation proves particularly important for mortgage valuations that differ significantly from purchase prices, helping lenders understand the professional reasoning.
4. Communicate Uncertainty Transparently
Professional integrity requires acknowledging valuation uncertainty in volatile markets. Rather than presenting single-point valuations, surveyors should:
- Provide valuation ranges reflecting market uncertainty
- Explain key assumptions and their impact
- Highlight factors that could affect future values
- Distinguish between current valuation and price prediction
5. Leverage Multiple Valuation Methods
Cross-checking valuations using multiple approaches increases confidence:
- Use CMA as primary method
- Validate with income approach for investment properties
- Consider cost approach for unique properties
- Compare results to algorithmic AVMs
- Reconcile differences and document reasoning
Understanding different types of surveyors and their specializations helps clients select professionals with appropriate valuation expertise.
The Future of Regional Valuation: Trends to Watch
Continued Divergence or Convergence?
The critical question for 2026 and beyond: will regional gaps continue widening, stabilize, or eventually converge? Several factors will influence this trajectory:
Factors supporting continued Northern growth:
- Ongoing remote work flexibility
- Government leveling-up investment
- Relative affordability advantages
- Quality of life considerations
Factors that could reverse trends:
- Return-to-office mandates affecting London demand
- Economic recession impacting Northern employment
- Interest rate changes affecting affordability calculations
- Policy interventions targeting regional imbalances
Surveyors must monitor these factors and adjust valuation techniques accordingly.
Technology Integration
Artificial intelligence and machine learning will increasingly augment surveyor judgment, particularly for:
- Pattern recognition in complex regional datasets
- Predictive modeling of market trajectories
- Automated adjustment factor calculations
- Risk assessment and scenario modeling
However, technology will complement rather than replace professional expertise, particularly in unprecedented market conditions like current regional divergence.
Regulatory Evolution
The Royal Institution of Chartered Surveyors (RICS) continues evolving valuation standards to address market complexity. Surveyors should anticipate:
- Enhanced regional adjustment guidance
- Stricter documentation requirements
- Increased scrutiny of optimistic valuations in growth markets
- Greater emphasis on uncertainty communication
Staying current with RICS professional standards remains essential for compliant practice.
Conclusion
Valuation Techniques for Northern England vs Southern Stagnation: Surveyor Tools for 2026 Regional Price Gaps represent both challenge and opportunity for property professionals. The unprecedented divergence between Northern growth markets (6-7% increases) and Southern stagnation (London at -1.2% decline) demands sophisticated, regionally-calibrated valuation approaches.
Surveyors must master comparative market analysis while applying carefully considered regional adjustment factors. Understanding the distinctions between market, mortgage, and tax valuations becomes critical when these figures diverge significantly across regions. Technology platforms provide valuable data support, but professional judgment remains irreplaceable—particularly when historical patterns no longer predict future performance.
Key Action Steps for Surveyors:
✅ Develop regional specialization rather than attempting national coverage
✅ Update comparable sales databases monthly in volatile markets
✅ Document all adjustment factors with clear supporting rationale
✅ Communicate valuation uncertainty transparently to clients
✅ Cross-check valuations using multiple methodological approaches
✅ Monitor economic indicators affecting regional market trajectories
✅ Stay current with RICS guidance on regional valuation standards
For property buyers, sellers, and investors, working with qualified professionals who understand these regional dynamics has never been more important. Whether you're navigating Northern growth markets or Southern stagnation, accurate valuation provides the foundation for sound property decisions.
The UK property market's regional transformation will likely continue throughout 2026 and beyond. Surveyors who adapt their techniques, embrace data-driven tools, and maintain rigorous professional standards will provide the most valuable guidance through this complex landscape.
References
[1] Valuation Divergence North Vs South Uk House Prices In 2026 And Surveyor Adjustment Techniques – https://nottinghillsurveyors.com/blog/valuation-divergence-north-vs-south-uk-house-prices-in-2026-and-surveyor-adjustment-techniques
[2] Valuation Techniques For Northern England Property Boom 2026 Rics Methods Amid 6 7 Price Surges – https://nottinghillsurveyors.com/blog/valuation-techniques-for-northern-england-property-boom-2026-rics-methods-amid-6-7-price-surges
[3] Valuing Regional Price Disparities In 2026 Surveyor Insights From Rics Data On North South Divides – https://nottinghillsurveyors.com/blog/valuing-regional-price-disparities-in-2026-surveyor-insights-from-rics-data-on-north-south-divides
[4] Property Valuation Explained Uk Guide 2026 – https://kefihub.co.uk/trending/property-valuation-explained-uk-guide-2026/