
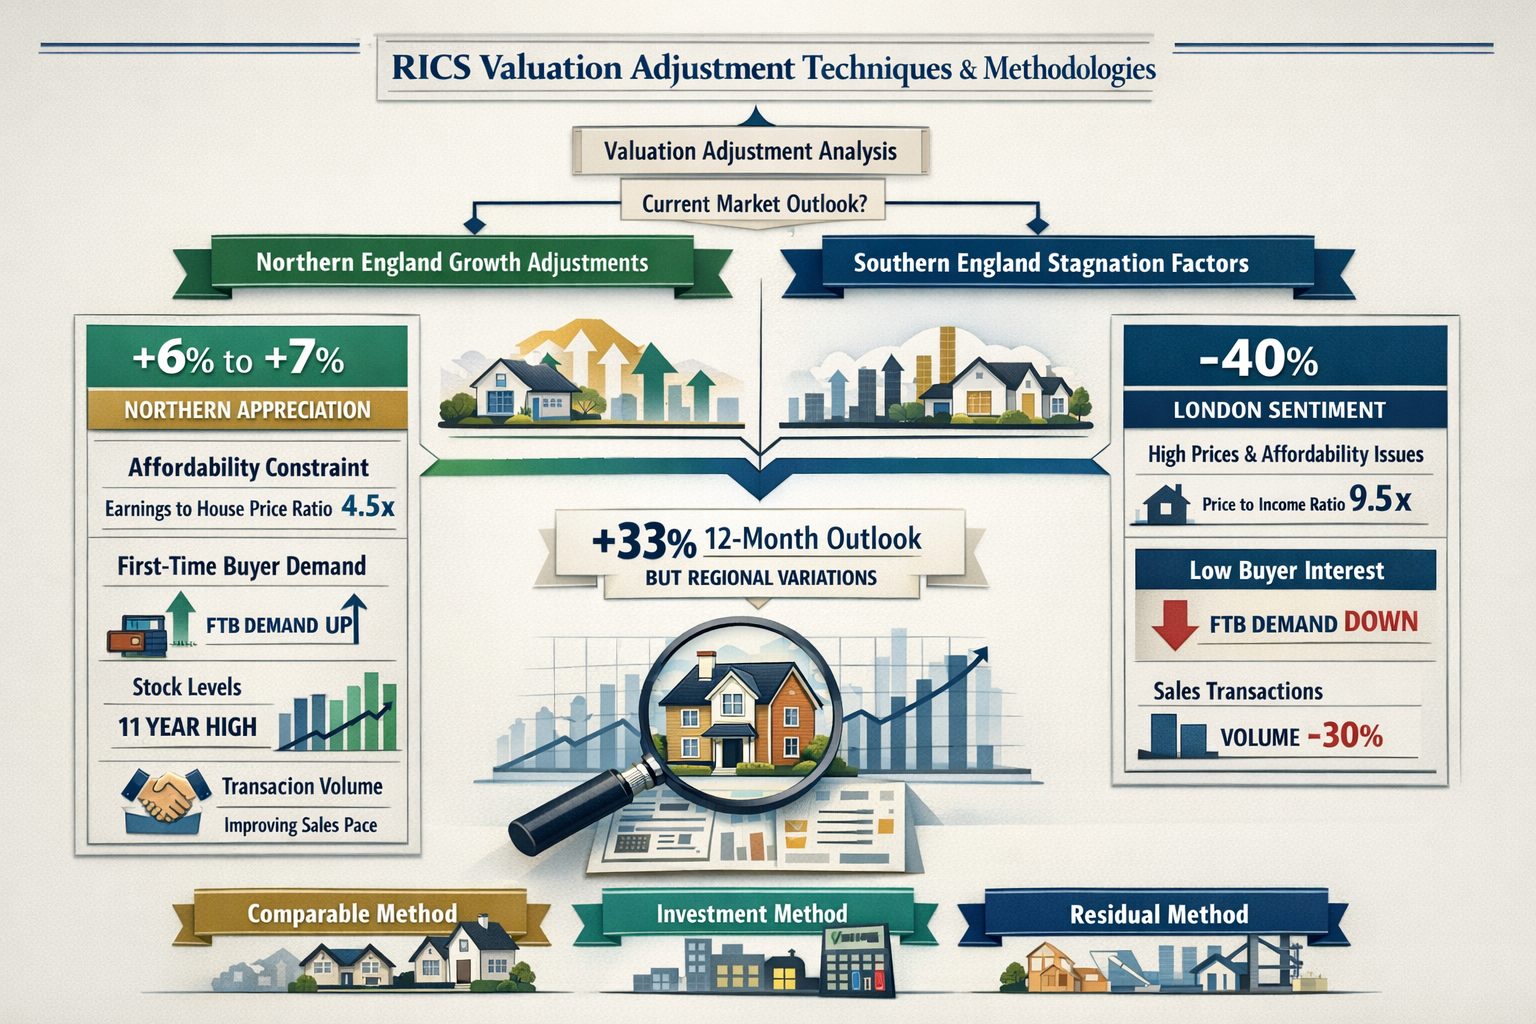
The UK property market in 2026 has revealed a striking geographic divide that challenges traditional valuation approaches. While national headlines suggest price stabilisation, chartered surveyors face an unprecedented regional divergence: Northern England properties surge ahead with 6-7% price appreciation, whilst London and the South East experience their steepest declines in over a decade. Understanding Valuing Properties in Northern England vs Southern Stagnation: 2026 RICS Regional Survey Tactics has become essential for property professionals navigating this transformed landscape.
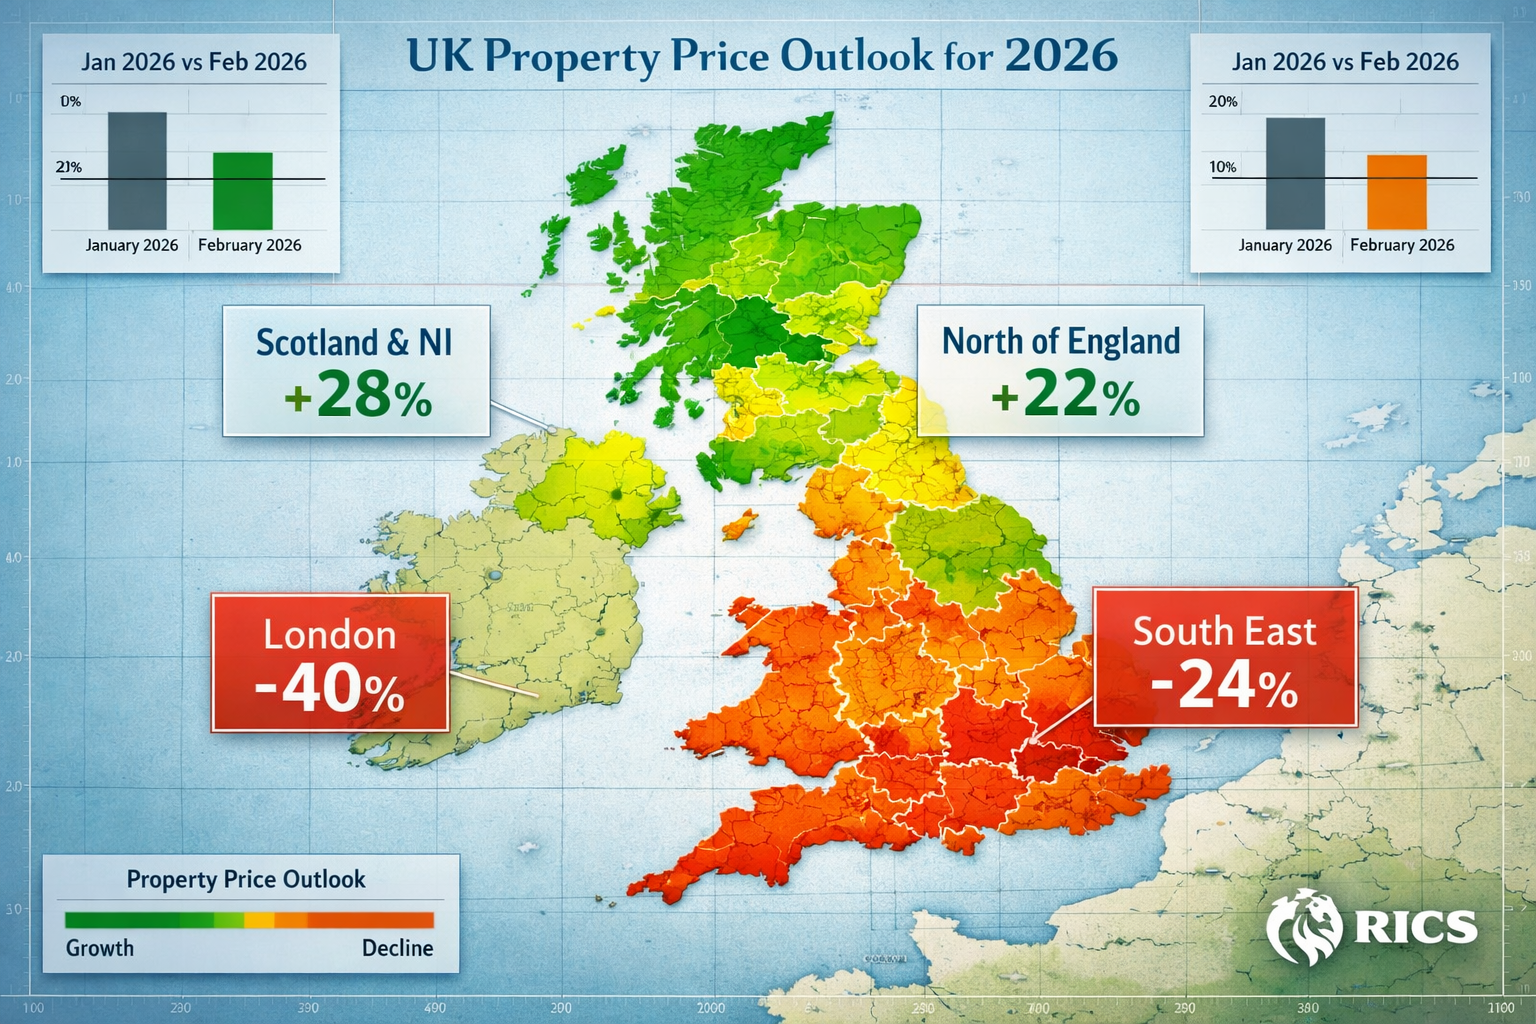
The February 2026 RICS UK Residential Market Survey exposed this chasm with stark clarity—London respondents reported a net balance of -40% for near-term price expectations, whilst Scotland, Northern Ireland, and Northern England regions continue their upward trajectories.[2] For valuers, this creates complex challenges: how do you accurately assess properties when comparable evidence varies so dramatically by postcode?
This comprehensive guide examines the regional price dynamics reshaping UK property valuation in 2026, providing RICS-qualified surveyors and property professionals with practical adjustment techniques, market intelligence, and strategic approaches for conducting accurate RICS building surveys and valuations across this divided market.
Key Takeaways
- 🏠 Northern England leads price growth with 6-7% appreciation in 2026, whilst London faces -40% negative sentiment—the most severe regional divergence in recent history
- 📊 Regional adjustment factors are critical for accurate valuations, with surveyors needing distinct methodologies for growth markets versus stagnation zones
- 🔍 First-time buyer demand drives Northern recovery, creating opportunities in lower-priced properties whilst Southern affordability constraints suppress transactions
- 📈 Stock levels at 11-year highs benefit Northern buyers but complicate comparable selection for valuers working across multiple regions
- ⚖️ RICS valuation standards require regional context, with surveyors adapting comparable evidence, yield assumptions, and market sentiment indicators based on geographic location
Understanding the 2026 Regional Property Divide
The North-South Price Performance Gap
The 2026 property market has crystallised into two distinct economies. Scotland and Northern Ireland continue to lead price growth, with momentum carrying through both January and February 2026.[1] Following closely behind, the North West and North of England regions demonstrate upward price trajectories that contrast sharply with Southern performance.[2]
This divergence isn't marginal—it represents a fundamental restructuring of UK property values. Key Northern England locations experienced price surges ranging from 6-7% in 2026, reflecting stronger market momentum and renewed buyer confidence.[4] Meanwhile, London's 12-month price outlook collapsed from +56% in January to just +7% in February, indicating dramatically weakened confidence among surveyors regarding Southern growth prospects.[2]
Quantifying Regional Sentiment: The RICS Net Balance Data
The RICS survey methodology measures market sentiment through net balance figures—the percentage of respondents reporting increases minus those reporting decreases. February 2026 data reveals:
| Region | 3-Month Price Expectation | Market Characterisation |
|---|---|---|
| London | -40% | Severe downward pressure |
| South East | -24% | Significant affordability constraints |
| East Anglia | -26% | Declining sentiment |
| North West | Positive trajectory | Growth momentum |
| Northern England | Positive trajectory | Strong appreciation |
| Scotland | Strongest performance | Continued growth |
This data provides crucial context for valuers conducting RICS home surveys across different regions. The -40% London figure represents the most negative regional sentiment in the entire UK, whilst Northern regions maintain positive momentum.[3]
Why National Averages Mislead Valuers
While house prices appear stabilised at a national level as of January 2026, this headline figure conceals significant regional disparities.[1] For property professionals, relying on national statistics creates substantial valuation risk. A surveyor applying national appreciation assumptions to a London property would dramatically overvalue, whilst underestimating Northern England assets.
The national price stabilisation masks:
- Geographic wealth redistribution from South to North
- Affordability-driven migration patterns favouring Northern cities
- Investment yield differentials creating regional capital flow
- First-time buyer concentration in lower-priced Northern markets
Professional valuers must disaggregate national data and apply region-specific adjustment factors to maintain RICS Red Book compliance and deliver accurate market valuations.
Valuing Properties in Northern England: Growth Market Tactics

Adjusting Comparables in Appreciating Markets
When valuing properties in Northern England's growth markets, surveyors face the challenge of rapidly dating comparable evidence. A sale completed six months ago may undervalue current market conditions by 3-4% given the 6-7% annual appreciation rates.[4]
Key adjustment techniques include:
Time-based appreciation adjustments 📈
- Apply monthly appreciation factors derived from Land Registry Price Paid Data for specific postcodes
- Weight recent transactions more heavily than older comparables
- Consider seasonal variations in Northern markets (spring surge, winter softening)
Stock availability considerations 🏘️
- With stock at 11-year highs, increased supply may moderate future appreciation
- Assess whether comparable properties faced competitive bidding scenarios
- Evaluate days-on-market trends to gauge demand intensity
First-time buyer premium identification 💷
- Properties priced below £250,000 attract disproportionate demand in Northern markets
- Identify whether subject property falls within first-time buyer affordability brackets
- Adjust for Help to Buy scheme eligibility where applicable
When conducting Level 3 building surveys in Northern England, surveyors should incorporate market momentum indicators into valuation reports, noting whether observed appreciation trends appear sustainable or speculative.
Regional Yield Analysis for Investment Properties
Northern England's price growth creates compelling investment yields compared to Southern alternatives. Rental demand remains robust in cities like Manchester, Liverpool, and Leeds, whilst capital appreciation enhances total returns.
Yield calculation adjustments for Northern markets:
- Gross yields of 5-7% are achievable in many Northern locations versus 3-4% in London
- Void period assumptions should reflect strong rental demand (typically 2-4 weeks between tenancies)
- Capital appreciation forecasts should incorporate regional growth momentum whilst avoiding over-optimism
For valuers preparing investment appraisals, the combination of income yield plus capital growth in Northern England currently outperforms Southern alternatives by significant margins. This creates valuation premiums for well-located rental properties in growth corridors.
Comparables Selection in Competitive Northern Markets
The surge in Northern England property values creates comparable selection challenges. Surveyors must distinguish between:
✅ Genuine market transactions reflecting sustainable demand
❌ Outlier sales driven by unique buyer circumstances
✅ Arms-length purchases representing true market value
❌ Related party transactions that may not reflect open market conditions
Best practice for RICS registered valuers includes:
- Selecting minimum three to five comparables from the past 3-6 months
- Adjusting for property condition, location micro-factors, and transaction timing
- Weighting recent sales more heavily in rapidly appreciating markets
- Documenting adjustment rationale comprehensively for professional indemnity purposes
Valuing Properties in Southern England: Stagnation Adjustment Tactics
Navigating London's -40% Sentiment Challenge
London's February 2026 net balance of -40% for price expectations represents the most severe regional pessimism in the UK.[2] For surveyors valuing London properties, this creates distinct challenges compared to Northern England assignments.
Critical valuation considerations include:
Downward price pressure adjustments 📉
- Recent comparables may overstate current market values
- Apply negative time adjustments to sales completed 6-12 months ago
- Consider whether asking price reductions are becoming prevalent in specific London boroughs
Affordability constraint impacts 💰
- Average London house prices remain 10-12 times average earnings
- First-time buyer segment largely priced out of market
- Demand concentrated in higher-income professional segments only
Transaction velocity analysis 🐌
- Agreed sales remained subdued nationally at -12% net balance in February 2026[2]
- London properties experiencing extended marketing periods
- Buyers exercising greater negotiating leverage in stagnant markets
When conducting chartered surveyor assessments in North London or other Southern locations, valuers must carefully document market condition assumptions and avoid over-reliance on historical growth patterns.
South East and East Anglia: The Affordability Squeeze
The South East (-24%) and East Anglia (-26%) regions face comparable affordability challenges to London, though slightly less severe.[2] These regions experience:
- Commuter belt vulnerability as remote working reduces London proximity premium
- Interest rate sensitivity given higher average mortgage sizes
- Limited first-time buyer activity due to elevated entry prices
For valuers working across Berkshire or Sussex locations, adjustment factors should reflect:
- Reduced demand from London overspill buyers
- Increased stock levels creating buyer-favourable conditions
- Potential for asking price reductions of 5-10% in slower micro-markets
Identifying Pockets of Resilience in Southern Markets
Not all Southern properties face uniform stagnation. Valuers should identify micro-market resilience factors:
🏆 Premium locations with unique amenities maintain value better
🏫 School catchment areas for outstanding-rated schools show demand stability
🚉 Transport connectivity to London employment centres supports values
🏡 Property condition with modern specifications outperforms dated stock
When preparing homebuyer surveys, surveyors should assess whether the subject property possesses characteristics that insulate it from broader regional stagnation trends.
RICS Survey Tactics for Valuing Properties in Northern England vs Southern Stagnation
Comparable Evidence Adjustment Framework
Professional valuers require systematic adjustment frameworks when working across the North-South divide. The following methodology ensures RICS Red Book compliance whilst reflecting 2026 regional dynamics:
Step 1: Establish Regional Baseline
- Identify whether subject property falls within growth region (Northern England, Scotland, Northern Ireland) or stagnation zone (London, South East, East Anglia)
- Review latest RICS regional survey data for sentiment indicators
- Assess local Land Registry price trends for specific postcode districts
Step 2: Select Appropriate Comparables
- Prioritise transactions from past 3-6 months in growth markets
- Extend comparable search to 6-12 months in stagnant markets (with time adjustments)
- Ensure minimum three comparables, ideally five or more for robust analysis
Step 3: Apply Regional Time Adjustments
- Northern England growth markets: Apply +0.5% to +0.8% monthly appreciation adjustment to older comparables
- Southern stagnation markets: Apply -0.2% to -0.5% monthly depreciation adjustment where evidence supports
- Stable regions: Minimal time adjustment unless specific local factors indicate otherwise
Step 4: Incorporate Market Sentiment Factors
- Adjust valuation ranges based on RICS net balance data
- In growth markets, favour upper end of valuation range
- In stagnant markets, adopt conservative mid-to-lower range positions
Step 5: Document Adjustment Rationale
- Provide comprehensive commentary on regional market conditions
- Reference RICS survey data and local market intelligence
- Ensure professional indemnity insurance coverage through transparent methodology
Adapting Survey Levels to Regional Market Conditions
The choice between Level 2 and Level 3 surveys may be influenced by regional market dynamics:
Northern England considerations:
- Rapid price appreciation may justify more comprehensive Level 3 surveys to protect buyers' increased investment
- Competitive markets with reduced negotiation opportunities make thorough pre-purchase inspection critical
- Older housing stock in Northern terraced housing requires detailed structural assessment
Southern England considerations:
- Stagnant markets provide buyers greater negotiation leverage post-survey
- Level 2 surveys may suffice for modern properties in good condition
- Buyers can request repairs or price reductions based on survey findings more successfully than in competitive Northern markets
Technology-Enabled Regional Valuation Approaches
Modern valuation technology enables surveyors to manage regional complexity more effectively:
Automated Valuation Models (AVMs) with regional weighting 🤖
- Use AVMs as sense-check against manual valuations
- Ensure AVM algorithms incorporate recent regional trend data
- Override AVM outputs where local knowledge indicates divergence
Geographic Information Systems (GIS) analysis 🗺️
- Map comparable transactions with heat-mapping for price trends
- Identify micro-market boundaries within broader regions
- Assess proximity to amenities, transport, and demand drivers
Market sentiment dashboards 📊
- Monitor RICS monthly survey releases for regional updates
- Track buyer enquiry trends from portal data (Rightmove, Zoopla)
- Incorporate estate agent feedback from multiple sources
Strategic Implications for Different Stakeholder Groups
For Buyers: Timing and Location Decisions
The North-South divide creates distinct strategic opportunities based on buyer circumstances:
First-time buyers 🏠
- Northern England offers affordability combined with capital appreciation potential
- Southern markets provide negotiation opportunities but limited growth prospects
- Consider what survey you need based on regional risk profiles
Investors and landlords 💼
- Northern yields (5-7%) plus capital growth outperform Southern alternatives
- London yields (3-4%) with stagnant capital values create total return challenges
- Regional diversification strategies may balance risk-return profiles
Relocators and lifestyle buyers 🚚
- Remote working flexibility enables Northern relocation with London salary retention
- Quality of life improvements in Northern cities (Manchester, Leeds, Newcastle) attract professional migration
- Southern buyers selling high-value properties can upgrade significantly in Northern markets
For Sellers: Pricing Strategy by Region
Sellers require regionally-adapted pricing strategies in 2026:
Northern England sellers:
- Price competitively but avoid undervaluation given strong demand
- Expect multiple offers in desirable locations and property types
- Marketing periods typically 4-8 weeks in active markets
Southern England sellers:
- Realistic pricing essential given buyer caution and affordability constraints
- Expect longer marketing periods (12-20 weeks increasingly common)
- Consider incentives (furniture packages, contribution to buyer costs) to stimulate offers
For Lenders: Risk Assessment and LTV Considerations
Mortgage lenders face differentiated risk profiles across regions:
Northern England lending:
- Strong appreciation trends support lending confidence
- Monitor for potential overheating in specific micro-markets
- First-time buyer concentration requires careful affordability assessment
Southern England lending:
- Stagnant or declining values increase negative equity risk
- Higher LTV lending carries elevated risk in falling markets
- Valuation scrutiny intensifies given downward price pressure
Long-Term Outlook: Will the Divide Persist?
12-Month Price Expectations: Regional Variations
Despite near-term caution, +33% of RICS respondents expect house prices to edge higher over a 12-month horizon as of February 2026, though this represents moderation from the +43% recorded in January.[2] This overall optimism masks significant regional variation:
Factors supporting Northern England continued strength:
- Structural affordability advantages persist
- Economic investment in Northern Powerhouse initiatives
- Quality of life and remote working flexibility
- Rental yield attractiveness for investors
Factors perpetuating Southern stagnation:
- Affordability constraints unlikely to resolve quickly
- Interest rate environment impacts higher-value mortgages disproportionately
- Limited wage growth relative to house prices
- Potential for further downward adjustment in overvalued micro-markets
Policy Interventions and Market Rebalancing
Government policy could influence regional dynamics through:
Demand-side interventions 📋
- First-time buyer schemes may disproportionately benefit Northern markets given price points
- Stamp duty adjustments could stimulate Southern transaction volumes
- Help to Buy regional price caps already reflect North-South differences
Supply-side measures 🏗️
- Planning reform and housebuilding targets vary by region
- Northern development may moderate appreciation if supply increases significantly
- Southern constraints (Green Belt, planning restrictions) limit supply response
Climate Risk and Regional Valuation Factors
Emerging climate considerations introduce new regional valuation variables:
- Flood risk affects specific Northern regions (Yorkshire, Lancashire river valleys)
- Coastal erosion impacts Southern and Eastern coastal locations
- Energy efficiency standards favour modern Northern new-builds over older Southern stock
- Structural surveys increasingly incorporate climate resilience assessment
Practical Valuation Scenarios: North vs South Case Studies
Scenario 1: Terraced House Valuation – Manchester vs London
Manchester (Northern England growth market):
- 3-bedroom Victorian terraced house
- Comparable sales 6 months ago: £220,000
- Current market assessment: £235,000 (+6.8% appreciation)
- Rental yield: 5.8%
- Marketing period: 6 weeks
- Buyer demand: Multiple offers expected
London (Southern stagnation market):
- 3-bedroom Victorian terraced house
- Comparable sales 6 months ago: £650,000
- Current market assessment: £630,000 (-3.1% adjustment)
- Rental yield: 3.4%
- Marketing period: 16 weeks
- Buyer demand: Limited enquiries, negotiation expected
Scenario 2: First-Time Buyer Property – Leeds vs South East
Leeds (Northern England):
- 2-bedroom apartment, modern development
- Price point: £180,000 (within first-time buyer range)
- Strong demand from young professionals
- Competitive offers above asking price
- Valuation confidence: High, supported by transaction volume
South East commuter town:
- 2-bedroom apartment, similar specification
- Price point: £285,000 (stretches first-time buyer affordability)
- Limited demand, extended marketing periods
- Offers 5-10% below asking price common
- Valuation confidence: Moderate, limited comparable transactions
Scenario 3: Investment Property Appraisal – Liverpool vs Brighton
Liverpool (Northern England):
- 2-bedroom flat near city centre
- Purchase price: £140,000
- Rental income: £850 pcm (7.3% gross yield)
- Capital appreciation forecast: +5% annually (next 3 years)
- Total return projection: 12.3% annually
Brighton (Southern England):
- 2-bedroom flat near seafront
- Purchase price: £320,000
- Rental income: £1,400 pcm (5.3% gross yield)
- Capital appreciation forecast: 0% to +1% annually (next 3 years)
- Total return projection: 5.3-6.3% annually
These scenarios demonstrate how Valuing Properties in Northern England vs Southern Stagnation: 2026 RICS Regional Survey Tactics requires fundamentally different analytical approaches, comparable selection criteria, and adjustment methodologies.
Conclusion
The 2026 UK property market presents an unprecedented regional divide that demands sophisticated, location-specific valuation approaches from RICS-qualified surveyors. Northern England's 6-7% price appreciation stands in stark contrast to London's -40% negative sentiment, creating distinct challenges for property professionals working across multiple regions.[2][4]
Accurate property valuation in this divided market requires:
✅ Regional market intelligence drawn from RICS monthly surveys and local transaction data
✅ Differentiated adjustment methodologies for growth markets versus stagnation zones
✅ Careful comparable selection with appropriate time-based adjustments
✅ Comprehensive documentation of regional assumptions and valuation rationale
✅ Technology-enabled analysis incorporating AVMs, GIS mapping, and sentiment dashboards
For buyers, the North-South divide creates strategic opportunities—Northern England offers affordability combined with growth potential, whilst Southern markets provide negotiation leverage despite limited appreciation prospects. Sellers must adapt pricing strategies to regional realities, with Northern properties commanding premium pricing in competitive markets whilst Southern sellers face extended marketing periods and buyer caution.
The long-term outlook suggests this regional divergence may persist, driven by structural affordability differences, remote working flexibility, and investment yield disparities. While overall market sentiment remains modestly positive with +33% of surveyors expecting price increases over 12 months[2], this masks significant geographic variation that valuers cannot ignore.
Next Steps for Property Professionals
For RICS surveyors:
- Review regional adjustment frameworks quarterly as market conditions evolve
- Maintain separate comparable databases for Northern growth and Southern stagnation markets
- Invest in technology tools that enable sophisticated regional analysis
- Consider specialist commercial building surveys training for regional variations
For buyers and investors:
- Engage qualified surveyors with specific regional expertise for your target location
- Request comprehensive RICS building surveys that incorporate regional market context
- Understand how regional dynamics affect both immediate valuation and long-term investment returns
- Review how long house surveys take when planning purchase timelines
For lenders and institutions:
- Implement differentiated risk assessment frameworks by region
- Monitor RICS monthly survey data for early warning indicators of regional shifts
- Adjust LTV policies to reflect regional risk-return profiles
- Consider regional diversification strategies for mortgage portfolios
The 2026 property market demonstrates that national averages mislead and regional expertise matters. Professional valuers equipped with robust regional survey tactics, comprehensive market intelligence, and systematic adjustment methodologies will deliver accurate assessments that protect clients and maintain RICS professional standards across this divided landscape.
References
[1] Uk Resi Survey Jan 2026 Report Shows Early Signs Market Recovery Despite Caution – https://www.rics.org/news-insights/uk-resi-survey-jan-2026-report-shows-early-signs-market-recovery-despite-caution
[2] Uk Residential Survey February 2026 – https://www.rics.org/news-insights/uk-residential-survey-february-2026
[3] Uk Residential Market Survey February 2026 – https://www.rics.org/content/dam/ricsglobal/documents/market-surveys/uk-residential-market-survey/UK-Residential-Market-Survey_February-2026.pdf
[4] Valuation Techniques For Northern England Property Boom 2026 Rics Methods Amid 6 7 Price Surges – https://nottinghillsurveyors.com/blog/valuation-techniques-for-northern-england-property-boom-2026-rics-methods-amid-6-7-price-surges
[5] Uk Residential Market Survey January 2026 – https://www.rics.org/content/dam/ricsglobal/documents/market-surveys/uk-residential-market-survey/UK-Residential-Market-Survey_January-2026.pdf