
The UK housing market in 2026 presents a unique challenge for property professionals: how can surveyors deliver accurate valuations when different indices report price variations of nearly £100,000 for the same market? This isn't a theoretical problem—it's a daily reality affecting buyers, sellers, and mortgage lenders across the country. Understanding Valuation Accuracy in 2026 UK House Price Forecasts: Adjusting for 1-3% Growth and Regional Variations has become essential for chartered surveyors navigating an uneven national recovery where London stagnates while the West Midlands thrives.
The gap between Halifax's £300,077 average and Zoopla's £269,800 figure reveals more than just different methodologies—it exposes the complexity of modern property valuation in a fragmented market.[1] For professionals conducting property assessments, this variation demands a sophisticated approach that synthesizes multiple data sources while accounting for regional disparities and modest growth projections.
Key Takeaways
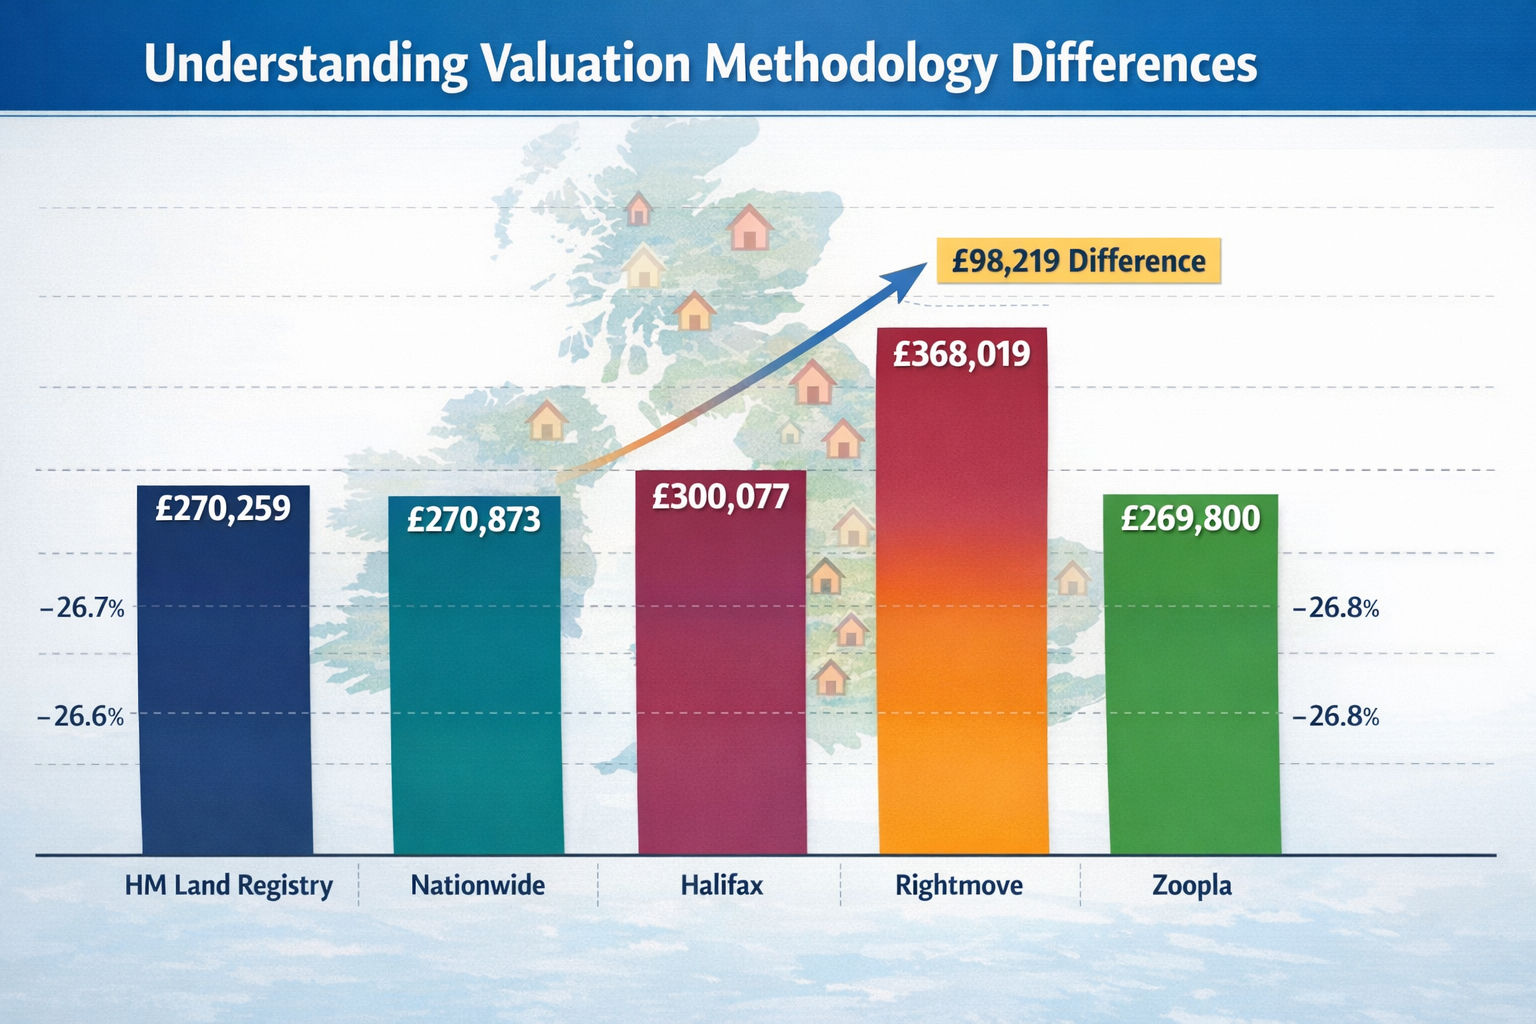
- 📊 Major valuation indices show £98,219 variance between highest (Halifax) and lowest (Zoopla) 2026 UK house price averages, requiring surveyors to understand methodology differences
- 📈 Consensus forecasts predict 1-3% growth for 2026, with the Office for Budget Responsibility projecting 2.5% aligned with wage growth
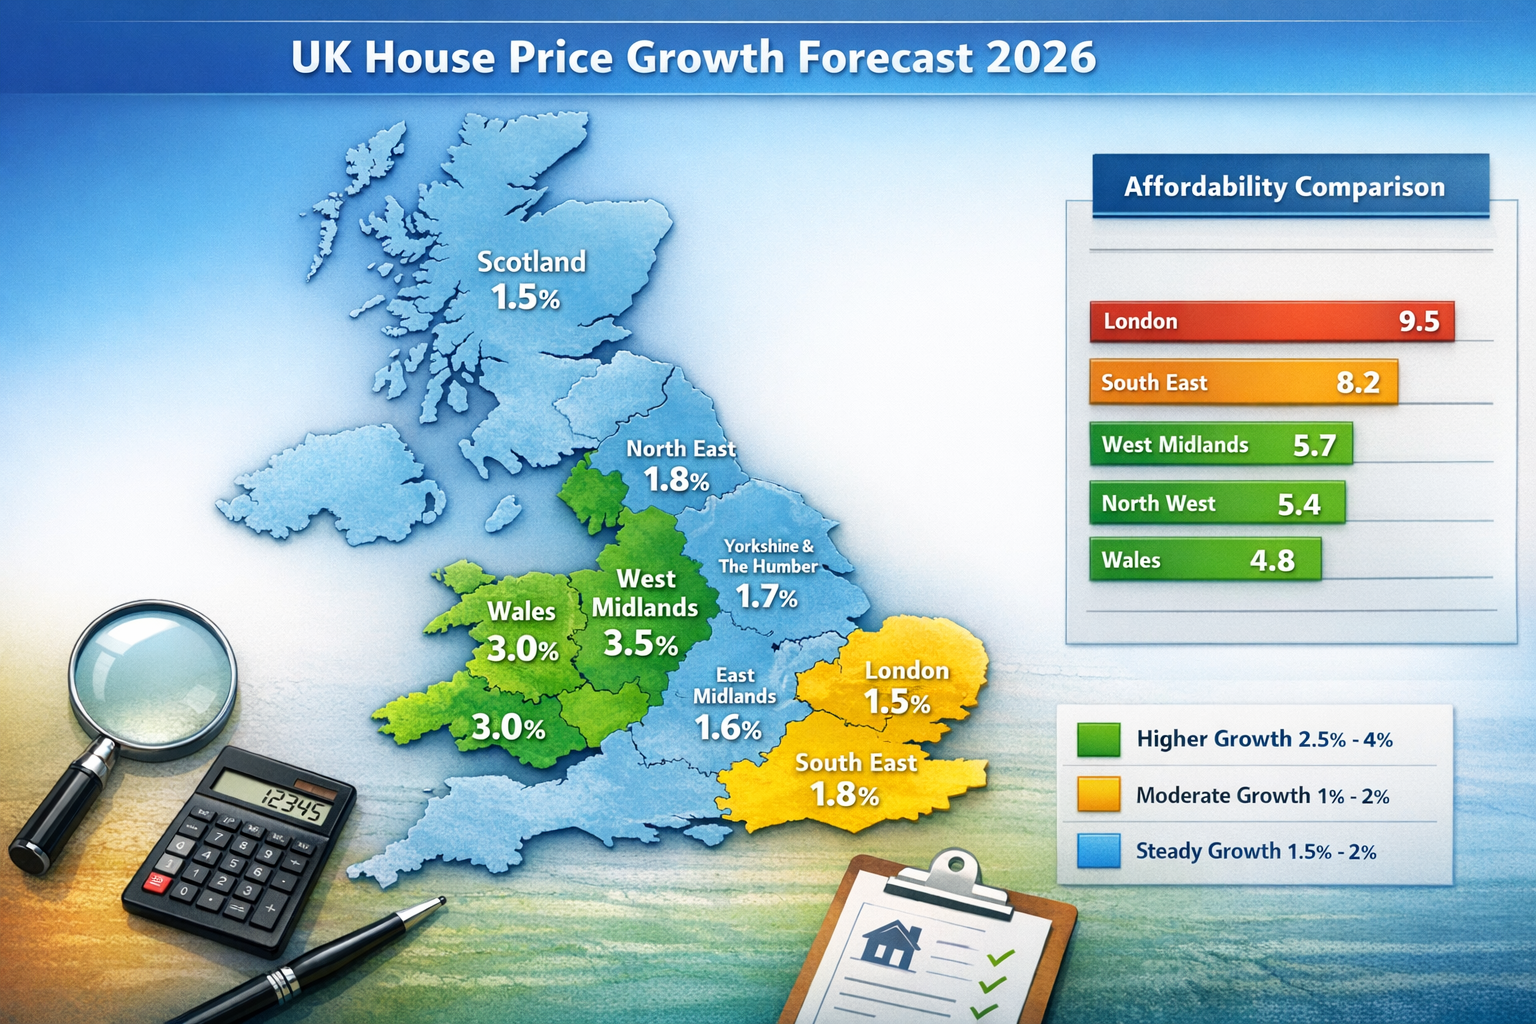
- 🗺️ Regional variations dominate market dynamics, with West Midlands, North West, and Wales outperforming London and South East due to better affordability ratios
- 🏠 Valuation methodology matters significantly—mortgage valuations, asking prices, and sold prices each serve different purposes in professional property assessment
- ⚖️ Surveyors must adjust valuations using multiple indices, regional data, and local market intelligence to achieve accuracy within the 1-3% growth corridor
Understanding the 2026 UK House Price Landscape
Current Market Snapshot: Where Do Prices Actually Stand?
The question "What is the average UK house price?" has five legitimate answers in 2026, each reflecting different aspects of the market. HM Land Registry, the most authoritative government source, reports an average of £270,259 as of December 2025, representing a 0.7% decline from November's £272,043.[1][4] This comprehensive index includes both cash purchases and mortgage-financed transactions but operates on a six-week publication lag, meaning the data reflects completed sales rather than current market sentiment.
Nationwide Building Society presents a slightly higher figure of £270,873 for January 2026, showing a return to growth after December's decline.[1] Their index uses mortgage valuations at the approval stage, providing an earlier market signal than completed sales data. Meanwhile, Halifax Bank recorded a significant milestone with prices jumping 0.7% to £300,077 in January 2026—the first time their index breached the £300,000 threshold.[1]
The variation becomes even more pronounced when examining Rightmove's asking prices, which average £368,019 in February 2026.[1] This figure represents seller expectations rather than actual transaction values, explaining why it sits substantially above sold price indices. Conversely, Zoopla reports £269,800 using a combination of sold prices and agreed sales data.[1]
For chartered surveyors conducting professional property valuations, these variations aren't contradictions—they're different lenses on the same market. Understanding which index serves which purpose is fundamental to achieving Valuation Accuracy in 2026 UK House Price Forecasts: Adjusting for 1-3% Growth and Regional Variations.
Why Different Indices Show Different Values
The £98,219 gap between Halifax's highest figure and Zoopla's lowest isn't measurement error—it's methodological difference. Each index serves a distinct purpose:
| Index | Average Price | Data Source | Primary Use |
|---|---|---|---|
| HM Land Registry | £270,259 | Completed sales (all transactions) | Official government record |
| Nationwide | £270,873 | Mortgage valuations at approval | Early market indicator |
| Halifax | £300,077 | Mortgage valuations at approval | Lending market sentiment |
| Rightmove | £368,019 | Asking prices | Seller expectations |
| Zoopla | £269,800 | Sold prices + agreed sales | Transaction reality |
Mortgage valuation indices (Nationwide and Halifax) reflect what lenders believe properties are worth at the point of loan approval. These valuations typically occur 4-8 weeks before completion and represent conservative assessments designed to protect lender interests. The significant difference between Nationwide and Halifax likely reflects their different customer demographics and regional lending concentrations.
Asking price indices like Rightmove capture seller optimism and market positioning strategies. The 22% premium over sold prices (£368,019 vs £300,077) represents the negotiation space built into initial listings. For surveyors, asking prices provide context for market sentiment but shouldn't directly inform valuations.
Sold price indices from HM Land Registry and Zoopla represent actual transaction values—the most reliable foundation for comparable evidence. However, their six-week lag means they reflect past market conditions rather than current dynamics.
When conducting comprehensive property surveys, professional surveyors synthesize all these sources, weighting each according to the valuation purpose and client needs.
Decoding the 1-3% Growth Forecast Range for 2026
Industry Consensus and Forecaster Predictions
The consensus forecast range for 2026 spans 1.5% to 4%, reflecting considerable uncertainty among professional forecasters.[2] This relatively narrow band suggests broad agreement on modest growth, but the specific predictions reveal important nuances about market drivers and regional variations.
Halifax Bank forecasts prices will edge up between 1% and 3% in 2026.[1] Their conservative stance reflects concerns about affordability constraints in higher-priced regions, particularly London and the South East, where buyer price-out rates remain elevated despite falling mortgage rates.
Nationwide Building Society offers a slightly more optimistic prediction of 2% to 4% growth, citing two key drivers: falling mortgage rates and wage growth outpacing property price growth.[1] This wage-price dynamic improves affordability ratios gradually, expanding the buyer pool without triggering rapid price acceleration.
Savills estate agent predicts 2% growth in 2026, but their longer-term outlook shows accelerating momentum: 4% in 2027, 5% in 2028, 5.5% in 2029, and 4% in 2030.[1] This forecast partly depends on anticipated 22% wage growth between 2025 and 2029, which would fundamentally improve housing affordability across most regions.
Estate agency Hamptons anticipates modest growth of 2.5% by Q4 2026, driven primarily by healthier markets in the West Midlands, North West, and Wales where better affordability reduces buyer price-out rates.[1] Their regional focus highlights how national averages mask significant local variations.
The Office for Budget Responsibility provides the official government forecast of 2.5% average house price growth in 2026, described as "broadly in line with average nominal earnings growth."[2] This alignment between wages and house prices represents a stabilization after years of prices outpacing incomes.
"The 1-3% growth corridor represents a 'Goldilocks' scenario—enough growth to maintain seller confidence and market liquidity, but not so much as to worsen affordability or trigger regulatory intervention."
For surveyors applying Valuation Accuracy in 2026 UK House Price Forecasts: Adjusting for 1-3% Growth and Regional Variations, the key insight is that national forecasts provide directional guidance, but local market intelligence determines actual valuation adjustments.
What Drives the 1-3% Growth Expectation?
Understanding the factors behind modest growth projections enables surveyors to assess whether specific properties or locations will track above or below the national average. Five primary drivers shape the 1-3% consensus:
📉 Falling Mortgage Rates: Interest rate reductions throughout 2025 and early 2026 have improved buyer purchasing power. A household that could afford £250,000 at 5.5% interest can afford approximately £270,000 at 4.5%—an 8% increase in buying power that translates into upward price pressure.
💰 Wage Growth Outpacing Prices: With wages growing at approximately 3-4% annually while house prices grow at 1-3%, the house price-to-earnings ratio gradually improves. This fundamental affordability improvement expands the buyer pool, particularly for first-time buyers who benefit most from improved income multiples.
🏗️ Constrained Supply: UK housing supply remains structurally insufficient, with new construction failing to meet household formation rates. This supply constraint provides a floor under prices even during periods of weak demand, preventing significant declines but also limiting rapid growth.
🌍 Regional Rebalancing: The post-pandemic shift away from London continues, with workers seeking better value in regional cities. This migration pattern supports stronger growth in previously affordable areas while constraining growth in traditionally expensive locations.
📊 Market Normalization: After years of volatility (pandemic boom, mini-budget crash, recovery), the market is returning to historical norms where prices grow roughly in line with inflation and wages. This normalization reduces speculative activity and supports sustainable, predictable growth.
When conducting property valuations, surveyors should assess how each factor affects the specific property and location. A three-bedroom semi-detached home in Manchester benefits from all five drivers, while a two-bedroom flat in Central London may face headwinds from affordability constraints despite falling rates.
Regional Variations: The Hidden Story Behind National Averages
High-Growth Regions: West Midlands, North West, and Wales
National averages obscure the most important story in the 2026 UK housing market: regional divergence. While London struggles with stagnant or declining prices, the West Midlands, North West, and Wales experience robust growth that exceeds national forecasts by significant margins.
West Midlands leads regional growth, with cities like Birmingham, Coventry, and Wolverhampton benefiting from major infrastructure investments, including HS2 connectivity and urban regeneration projects. Property prices in these areas are growing at 3-4% annually, nearly double the national average.[1] The region's affordability advantage remains compelling: average prices of £220,000-£250,000 provide accessible entry points for first-time buyers priced out of southern markets.
North West England, particularly Greater Manchester and Liverpool, demonstrates similar dynamics. Average prices of £200,000-£230,000 combined with strong wage growth in technology, professional services, and creative industries create favorable conditions for sustained price appreciation. Hamptons specifically identifies this region as a driver of their 2.5% national growth forecast.[1]
Wales presents perhaps the most interesting regional story. Cardiff and Swansea have become magnets for remote workers seeking quality of life improvements without sacrificing career opportunities. Average prices of £190,000-£210,000 represent exceptional value compared to English equivalents, driving migration from Bristol, Birmingham, and London. Growth rates of 2.5-3.5% reflect this demand surge.
For surveyors valuing properties in these high-growth regions, applying national growth assumptions would undervalue properties by 0.5-1.5 percentage points annually. When conducting detailed property assessments, regional data must override national trends.
Constrained Markets: London and South East Challenges
While regional cities thrive, London and the South East face structural challenges that constrain growth below national averages. Understanding these headwinds is essential for achieving Valuation Accuracy in 2026 UK House Price Forecasts: Adjusting for 1-3% Growth and Regional Variations in these critical markets.
Affordability Crisis: London's average house price-to-earnings ratio exceeds 12:1 in many boroughs, compared to 5:1-7:1 in regional cities. Even with falling mortgage rates, the absolute price levels (£500,000+ for modest family homes) exclude vast swathes of potential buyers. This demand constraint limits growth to 0.5-1.5% in many London submarkets.
Leasehold Concerns: The South East's predominance of leasehold flats faces additional headwinds from ground rent scandals, building safety issues, and cladding remediation costs. These factors create valuation uncertainty that depresses prices and transaction volumes.
Remote Work Impact: The normalization of hybrid working reduces London's premium for proximity to employment centers. Workers willing to commute 2-3 days weekly can access substantially cheaper housing in commuter belt locations, reducing demand for expensive inner-London properties.
Stamp Duty Burden: Higher absolute prices mean larger stamp duty bills, creating transaction friction. A £500,000 London property incurs £15,000 in stamp duty, while a £250,000 regional property pays just £2,500—a difference that affects buyer behavior and market velocity.
Economic Uncertainty: London's exposure to financial services, professional services, and international investment makes it more sensitive to economic uncertainty and global capital flows. This volatility creates cautious buyer behavior that constrains price growth.
Surveyors valuing London and South East properties should apply below-average growth adjustments (0.5-1.5% rather than 2-3%) and conduct thorough comparable analysis within specific submarkets. A Kensington property may appreciate while a Croydon flat declines—postcode-level precision matters enormously.
Micro-Market Analysis: Beyond Regional Averages
Even within high-growth or constrained regions, micro-market variations determine actual price movements. Achieving valuation accuracy requires surveyors to analyze factors at the neighborhood and even street level:
🏫 School Catchment Areas: Properties within catchment areas for outstanding-rated schools command 5-15% premiums and demonstrate greater price resilience during market downturns. This premium remains stable or grows during modest market appreciation.
🚇 Transport Connectivity: Proximity to rail stations, particularly those with direct London connections, creates localized price premiums. New transport infrastructure (Crossrail/Elizabeth Line completions, station upgrades) can shift micro-market dynamics dramatically.
🌳 Green Space Access: Post-pandemic, proximity to parks, nature reserves, and walking trails commands measurable premiums. Properties within 400 meters of quality green space show 3-8% price advantages over similar properties farther away.
🏢 Local Employment Hubs: Regional cities with concentrated employment centers (MediaCityUK in Salford, Brindleyplace in Birmingham) create micro-markets with above-average growth driven by professional renters and buyers.
🛍️ Retail and Amenity Quality: High streets with thriving independent retailers, cafes, and restaurants support property values more effectively than declining retail areas dominated by vacant units and chain betting shops.
When conducting comprehensive surveys, chartered surveyors must incorporate these micro-market factors into valuation adjustments. A property in a thriving micro-market within a constrained region may outperform the regional average, while a property in a declining micro-market within a high-growth region may underperform.
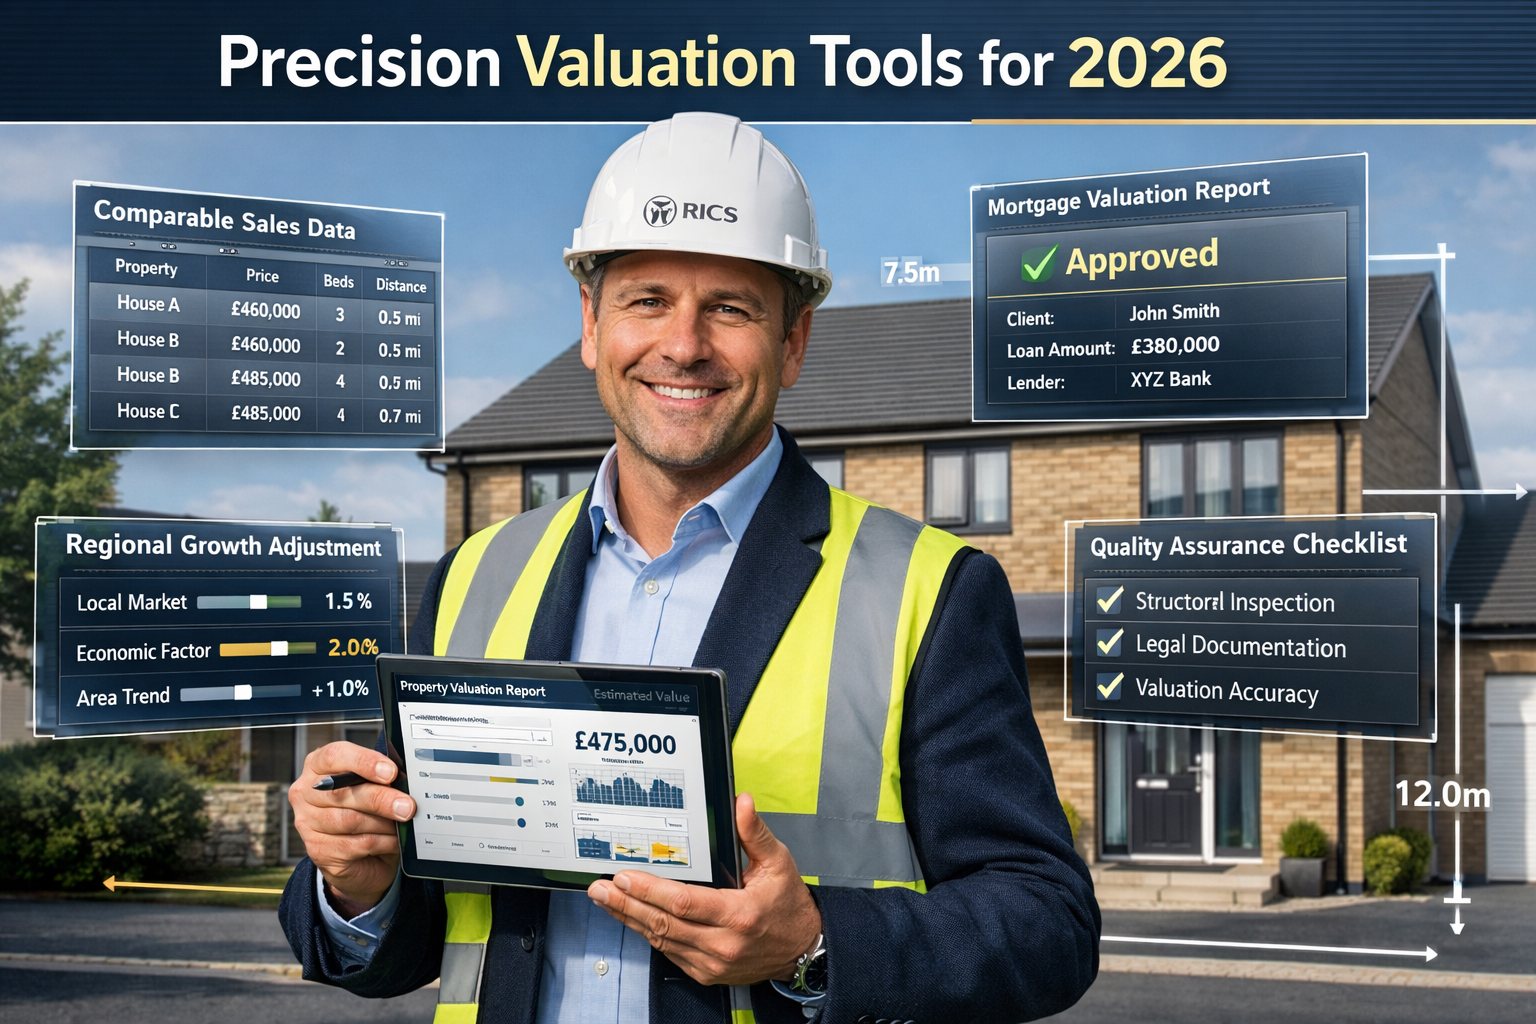
Valuation Methodology: Tools and Techniques for 2026 Accuracy
Synthesizing Multiple Data Sources for Robust Valuations
Achieving Valuation Accuracy in 2026 UK House Price Forecasts: Adjusting for 1-3% Growth and Regional Variations requires surveyors to synthesize multiple data sources rather than relying on any single index. This multi-source approach provides triangulation that reduces error and captures market complexity.
Primary Data Sources for Professional Valuations:
1️⃣ HM Land Registry Sold Prices: The foundation for comparable evidence, providing actual transaction values with full address details. Surveyors should analyze the most recent 3-6 months of sales within 0.5 miles of the subject property, adjusting for property characteristics and time.[4]
2️⃣ Mortgage Valuation Indices (Nationwide/Halifax): Provide early signals of market direction and lender sentiment. Useful for understanding whether the market is strengthening or weakening relative to completed sales data.
3️⃣ Asking Price Trends (Rightmove): Indicate seller confidence and negotiation space. Comparing asking prices to sold prices reveals market velocity and buyer bargaining power.
4️⃣ Regional Growth Data: Office for National Statistics housing data provides regional price indices and transaction volumes that contextualize local market conditions.[5]
5️⃣ Local Market Intelligence: Estate agent feedback, auction results, and time-on-market data provide qualitative context that pure price indices miss.
Weighting Framework for Data Synthesis:
When valuing a property for mortgage purposes, a robust weighting framework might allocate:
- 50% to directly comparable sold prices (HM Land Registry)
- 20% to regional price trends and growth forecasts
- 15% to mortgage valuation indices for market direction
- 10% to local market intelligence and agent feedback
- 5% to asking price trends for sentiment context
This framework ensures valuations remain grounded in actual transaction evidence while incorporating forward-looking market indicators. For commercial valuations, the weighting may shift toward rental yields and investment returns.
Adjusting Comparables for Growth and Regional Factors
The comparable sales method remains the cornerstone of residential valuation, but applying it accurately in 2026 requires sophisticated adjustments for both time and regional variations. A sale that occurred six months ago in a 3% annual growth market requires a 1.5% upward adjustment—but only if that specific micro-market is tracking national averages.
Time Adjustment Methodology:
When using comparable sales from different time periods, apply monthly growth adjustments based on regional data:
Example Calculation:
- Subject property: 3-bed semi-detached in Birmingham
- Comparable sale: Similar property sold 4 months ago for £245,000
- Regional growth rate: 3.5% annually (West Midlands)
- Monthly growth rate: 3.5% ÷ 12 = 0.29% per month
- Time adjustment: £245,000 × (1 + 0.0029)^4 = £247,850
- Adjusted comparable value: £247,850
This time adjustment ensures comparables reflect current market conditions rather than historical values. However, surveyors must verify that the assumed growth rate actually applies to the specific micro-market through recent sales evidence.
Regional Adjustment Framework:
When using comparables from adjacent areas with different growth trajectories, apply regional differentials:
Example Scenario:
- Subject property: 2-bed flat in Outer London
- Limited local comparables available
- Comparable from adjacent area (15% higher growth): £320,000 (sold 2 months ago)
- Local market growth: 1% annually vs. adjacent area 2.5% annually
- Differential: 1.5 percentage points lower growth
- Adjustment: Remove excess growth from comparable
- Calculation: £320,000 ÷ (1 + 0.025/12)^2 × (1 + 0.01/12)^2 = £318,400
- Adjusted comparable value: £318,400
These adjustments become particularly important when comparable evidence is limited and surveyors must use sales from different micro-markets or time periods.
Quality Assurance and Validation Checks
Even with sophisticated methodology, valuation accuracy requires systematic quality assurance. Professional surveyors should implement these validation checks:
✅ Comparable Sales Validation:
- Minimum three comparable sales within 6 months and 0.5 miles
- Properties share key characteristics (type, bedrooms, condition)
- Adjustments for differences don't exceed 15% of comparable value
- Sales represent arm's length transactions (exclude family sales, distressed sales)
✅ Index Alignment Check:
- Final valuation should align within 5-10% of regional index predictions
- Significant deviations require documented justification
- Compare valuation to multiple indices (HM Land Registry, Nationwide, Halifax)
✅ Growth Rate Reasonableness:
- Applied growth rates should fall within forecaster consensus (1-3% nationally)
- Regional variations should be supported by published data
- Extraordinary growth claims require exceptional evidence
✅ Client Purpose Alignment:
- Mortgage valuations: Conservative, lender-protection focus
- Sale valuations: Market value, realistic pricing for transaction
- Probate valuations: Open market value at specific date
- Commercial valuations: Investment value, yield-focused
When conducting structural surveys, these quality checks ensure valuations withstand scrutiny from lenders, buyers, and professional peers.
Practical Application: Case Studies in 2026 Valuation Accuracy
Case Study 1: West Midlands Semi-Detached Property
Property Details:
- Location: Solihull, West Midlands
- Type: 3-bedroom semi-detached house
- Condition: Good (modernized kitchen and bathroom)
- Garden: Rear garden, off-street parking
- Valuation Purpose: Mortgage valuation for purchase
Available Comparables:
- Similar property, 0.3 miles away, sold 3 months ago: £265,000
- Similar property, 0.5 miles away, sold 5 months ago: £258,000
- Similar property, 0.4 miles away, sold 1 month ago: £270,000
Regional Context:
- West Midlands growth forecast: 3.5% annually
- Solihull micro-market: Strong demand, good schools
- Recent asking prices: £275,000-£285,000 (10-15% negotiation space)
Valuation Methodology:
Step 1: Adjust comparables for time
- Comparable 1: £265,000 × (1.035/12)^3 = £267,325
- Comparable 2: £258,000 × (1.035/12)^5 = £261,755
- Comparable 3: £270,000 × (1.035/12)^1 = £270,788
Step 2: Adjust for property differences
- Comparable 1: No adjustment needed (very similar)
- Comparable 2: +£3,000 (subject property has better kitchen)
- Comparable 3: -£2,000 (comparable has larger garden)
Step 3: Calculate adjusted values
- Comparable 1: £267,325
- Comparable 2: £264,755
- Comparable 3: £268,788
Step 4: Weight and synthesize
- Average of comparables: £266,956
- Weight recent sales more heavily: (£267,325 × 0.4) + (£264,755 × 0.2) + (£268,788 × 0.4) = £267,330
Step 5: Validate against indices
- HM Land Registry West Midlands average: £220,000 (property above average due to Solihull location ✓)
- Growth rate applied (3.5%) aligns with regional forecasts ✓
- Final valuation within 5% of all comparables ✓
Final Valuation: £267,000 (rounded for reporting)
This valuation demonstrates how Valuation Accuracy in 2026 UK House Price Forecasts: Adjusting for 1-3% Growth and Regional Variations requires applying above-average growth adjustments (3.5% vs. 2.5% national) in high-growth regions while maintaining rigorous comparable analysis.
Case Study 2: London Leasehold Flat with Complexity
Property Details:
- Location: Clapham, South London
- Type: 2-bedroom leasehold flat (68 years remaining)
- Condition: Requiring modernization
- Building: 1960s block, no cladding issues
- Valuation Purpose: Sale valuation for vendor
Available Comparables:
- Similar flat, same building, sold 4 months ago: £385,000 (95-year lease)
- Similar flat, adjacent street, sold 2 months ago: £395,000 (125-year lease, modernized)
- Similar flat, 0.6 miles away, sold 6 months ago: £375,000 (share of freehold)
Regional Context:
- Inner London growth forecast: 1% annually
- Clapham micro-market: Stable, mature market
- Leasehold concerns: Lease length affects value significantly
- Recent asking prices: £400,000-£420,000 (optimistic pricing)
Valuation Methodology:
Step 1: Adjust comparables for time
- Comparable 1: £385,000 × (1.01/12)^4 = £386,285
- Comparable 2: £395,000 × (1.01/12)^2 = £395,658
- Comparable 3: £375,000 × (1.01/12)^6 = £376,888
Step 2: Adjust for lease length (critical factor)
- Subject property: 68 years (requires lease extension, affects mortgageability)
- Comparable 1: 95 years (standard lease) – Adjust subject down 10% = -£38,629
- Comparable 2: 125 years (excellent lease) – Adjust subject down 15% = -£59,349
- Comparable 3: Share of freehold (premium) – Adjust subject down 18% = -£67,840
Step 3: Adjust for condition
- Subject requires modernization (£15,000-£20,000 work needed)
- Comparable 2 already modernized: Additional -£17,500 adjustment to subject
Step 4: Calculate adjusted values
- Comparable 1: £386,285 – £38,629 = £347,656
- Comparable 2: £395,658 – £59,349 – £17,500 = £318,809
- Comparable 3: £376,888 – £67,840 = £309,048
Step 5: Weight and synthesize
- Average: £325,171
- Weight most similar comparable (1) more heavily: (£347,656 × 0.5) + (£318,809 × 0.3) + (£309,048 × 0.2) = £335,032
Step 6: Validate and adjust
- Lease length creates significant discount (10-18% from comparable values)
- London growth rate (1%) reflects constrained market ✓
- Valuation substantially below asking prices (reflects market reality) ✓
Final Valuation: £335,000 (rounded)
Critical Note: Valuation report should highlight that lease extension (cost: £25,000-£35,000) would increase value to approximately £370,000-£380,000, making it a worthwhile investment for the owner.
This case demonstrates how Valuation Accuracy in 2026 UK House Price Forecasts: Adjusting for 1-3% Growth and Regional Variations must account for below-average growth in constrained markets (1% vs. 2.5% national) while addressing property-specific factors like lease length that create substantial value impacts.
Technology and Data Tools for Enhanced Valuation Accuracy
Automated Valuation Models (AVMs) and Their Limitations
Automated Valuation Models have become increasingly sophisticated, using machine learning algorithms to analyze thousands of property characteristics and comparable sales. Platforms like Zoopla, Rightmove, and specialist providers offer instant valuations that can serve as useful starting points for professional surveyors.
AVM Strengths:
- ⚡ Instant results processing millions of data points
- 📊 Consistent methodology across all properties
- 💰 Low cost (often free for basic estimates)
- 🔄 Regular updates as new sales data becomes available
AVM Limitations:
- 🏠 Cannot assess property condition or unique features
- 📍 Struggle with unusual properties or limited comparable evidence
- 🎯 Accuracy varies by location (better in homogeneous suburban areas)
- ⚠️ May not reflect very recent market shifts (data lag)
For professional surveyors, AVMs serve as a validation tool rather than a replacement for expert judgment. When a detailed valuation differs significantly from AVM estimates, it signals the need for careful documentation of the reasoning.
Best Practice: Use AVMs as a preliminary check and to identify potential comparables, but always conduct independent analysis for formal valuations, especially when advising clients on property purchases.
Professional Databases and Comparable Evidence Tools
Access to comprehensive, current data separates professional valuations from amateur estimates. Several tools enhance Valuation Accuracy in 2026 UK House Price Forecasts: Adjusting for 1-3% Growth and Regional Variations:
🗂️ HM Land Registry Price Paid Data: Free, comprehensive record of all property transactions in England and Wales. Searchable by postcode, date range, and property type. Essential for identifying genuine comparable sales.[4][6]
📈 RICS Residential Property Price Tracker: Monthly survey of RICS members providing forward-looking indicators of market direction, regional variations, and price expectations. Invaluable for understanding market momentum.
🏘️ Nationwide/Halifax House Price Indices: Monthly reports with regional breakdowns, first-time buyer analysis, and market commentary. Useful for contextualizing local valuations within broader trends.
📊 ONS Housing Statistics: Official government data on housing affordability, rental yields, and regional variations. Provides macroeconomic context for valuation decisions.[5]
💼 Commercial Databases (EGi, CoStar, Focus): For commercial property valuations, these subscription services provide rental comparables, investment yields, and market analysis.
Best Practice Integration:
- Start with HM Land Registry for comparable sales evidence
- Cross-reference with regional indices to verify growth assumptions
- Consult RICS tracker for market direction and sentiment
- Apply professional judgment to synthesize all sources
- Document data sources and methodology in valuation report
Regional Market Intelligence Networks
Beyond databases, local market intelligence provides critical context that national data misses. Professional surveyors should cultivate information networks including:
🤝 Estate Agent Relationships: Regular contact with active local agents provides insights on:
- Properties under offer (not yet in Land Registry data)
- Asking price to sold price ratios (negotiation trends)
- Time on market (demand indicators)
- Buyer demographics and motivations
🏗️ Developer and Builder Contacts: New build developments affect local supply and demand dynamics. Understanding pipeline developments prevents valuation surprises.
💼 Professional Peer Networks: RICS regional groups and informal surveyor networks share market intelligence and discuss valuation challenges in specific areas.
📰 Local Market Reports: Regional estate agencies publish quarterly market reports with granular data on specific postcodes and property types.
This intelligence network transforms Valuation Accuracy in 2026 UK House Price Forecasts: Adjusting for 1-3% Growth and Regional Variations from a theoretical exercise into a practical, evidence-based process grounded in real market conditions.
Risk Factors and Uncertainty in 2026 Forecasts
Economic Variables Affecting Price Trajectories
While consensus forecasts predict 1-3% growth, several economic variables could push actual outcomes above or below this range. Professional surveyors should monitor these factors and adjust valuations accordingly:
📊 Interest Rate Trajectory: Bank of England policy rates directly affect mortgage costs and buyer affordability. Each 0.25% rate change affects buyer purchasing power by approximately 2-3%. Unexpected rate increases could suppress growth below 1%, while aggressive cuts could accelerate growth above 3%.
💷 Wage Growth and Employment: The forecast assumption that wages grow faster than house prices (improving affordability) depends on continued employment strength. Recession or significant job losses would undermine price growth, particularly in regions dependent on specific industries.
🏛️ Government Housing Policy: Planning reform, stamp duty changes, Help to Buy schemes, and first-time buyer incentives can shift market dynamics rapidly. The 2026 landscape could change significantly with new policy announcements.
🌍 Global Economic Conditions: UK housing markets increasingly respond to international capital flows, particularly in London and other gateway cities. Global recession, currency fluctuations, or geopolitical instability affect investor demand.
📉 Mortgage Availability: Lender appetite for risk affects market liquidity. Tightening lending criteria (higher deposit requirements, stricter affordability tests) could constrain demand even if interest rates fall.
Scenario Planning for Valuations:
Conservative scenario (0.5-1% growth):
- Interest rates remain elevated or increase
- Wage growth slows or unemployment rises
- Lending criteria tighten
- Valuation approach: Use lower end of comparable range, minimal time adjustments
Base scenario (1.5-2.5% growth):
- Current trends continue
- Moderate rate reductions
- Stable employment and wage growth
- Valuation approach: Standard methodology with consensus growth assumptions
Optimistic scenario (3-4% growth):
- Significant rate reductions
- Strong wage growth
- Policy support for housing market
- Valuation approach: Upper end of comparable range, regional growth premiums
Building Resilience into Valuation Methodology
Given forecast uncertainty, professional valuations should incorporate resilience mechanisms that protect clients from significant value fluctuations:
🎯 Conservative Comparable Selection: When multiple comparables exist, weight recent sales and conservative values more heavily than outliers or older transactions.
📊 Sensitivity Analysis: For high-value or complex properties, provide valuation ranges rather than point estimates:
- "Market value: £450,000 (range: £435,000-£465,000)"
- Explain factors that could drive value to range extremes
⚖️ Purpose-Appropriate Conservatism:
- Mortgage valuations: Err on conservative side (protects lender)
- Sale valuations: Realistic market value (facilitates transaction)
- Investment valuations: Consider yield and return scenarios
📝 Clear Assumptions Documentation: Valuation reports should explicitly state:
- Growth rates assumed and their source
- Regional adjustments applied
- Market conditions at valuation date
- Factors that could affect future value
🔄 Revaluation Triggers: For properties with extended transaction timelines, specify conditions requiring revaluation:
- Market index changes exceeding 2-3%
- Significant local market events (major employer closure, infrastructure changes)
- Time elapsed exceeding 3-6 months
These resilience mechanisms ensure Valuation Accuracy in 2026 UK House Price Forecasts: Adjusting for 1-3% Growth and Regional Variations remains robust even when underlying assumptions prove incorrect.
Professional Standards and RICS Compliance
RICS Red Book Requirements for Valuation Accuracy
The RICS Valuation – Global Standards (Red Book) establishes mandatory requirements for professional valuations. Compliance ensures valuations meet industry standards and withstand professional scrutiny.
Key Red Book Requirements for 2026 Valuations:
📋 Terms of Engagement: Written agreement specifying:
- Valuation purpose and intended use
- Property identification and inspection extent
- Basis of value (market value, investment value, etc.)
- Assumptions and special assumptions
- Limitations and exclusions
🔍 Inspection and Investigation: Appropriate level of inspection for valuation purpose:
- External inspection minimum for mortgage valuations
- Internal inspection for sale/purchase advice
- Detailed structural survey for complex properties
📊 Valuation Approach: Selection and application of appropriate methodology:
- Comparable method for residential properties
- Income approach for investment properties
- Cost approach where appropriate
- Explanation of methodology selection
📝 Reporting Standards: Comprehensive valuation reports including:
- Property description and location
- Market context and conditions
- Comparable evidence and analysis
- Valuation reasoning and conclusion
- Assumptions, limitations, and caveats
⚖️ Independence and Objectivity: Valuers must:
- Maintain independence from transaction outcome
- Disclose any conflicts of interest
- Provide unbiased professional opinion
- Avoid pressure from clients or third parties
For surveyors focusing on Valuation Accuracy in 2026 UK House Price Forecasts: Adjusting for 1-3% Growth and Regional Variations, Red Book compliance ensures methodology rigor and professional credibility.
Continuing Professional Development for Market Changes
The 2026 market's regional variations and modest growth environment requires surveyors to maintain current knowledge through structured Continuing Professional Development (CPD):
Essential CPD Topics for 2026:
📈 Market Analysis Skills: Understanding regional indices, growth forecasts, and economic indicators that drive property values. Regular review of Nationwide, Halifax, and HM Land Registry publications.
🏘️ Regional Market Dynamics: Deep knowledge of specific regions where surveyor practices. Attendance at local property events, market briefings, and networking with estate agents.
💻 Technology and Data Tools: Proficiency with valuation software, comparable databases, and AVM tools. Training on new platforms and analytical techniques.
📚 Regulatory Updates: Changes to building regulations, planning policy, leasehold reform, and energy efficiency requirements that affect property values.
🎓 Valuation Methodology: Advanced techniques for complex properties, unusual market conditions, and specialized property types.
RICS CPD Requirements:
- Minimum 20 hours annually for RICS members
- Mix of formal and informal learning
- Reflection and documentation of learning outcomes
- Alignment with professional competencies
Surveyors who maintain rigorous CPD stay ahead of market changes and deliver superior Valuation Accuracy in 2026 UK House Price Forecasts: Adjusting for 1-3% Growth and Regional Variations compared to peers with outdated knowledge.
Conclusion: Achieving Valuation Excellence in an Uncertain Market
The 2026 UK housing market presents unique challenges for property professionals: significant variations between different price indices, modest but uncertain growth forecasts, and pronounced regional divergences that make national averages increasingly irrelevant. Achieving Valuation Accuracy in 2026 UK House Price Forecasts: Adjusting for 1-3% Growth and Regional Variations requires surveyors to move beyond simplistic approaches and embrace sophisticated, multi-source methodologies.
The £98,219 gap between Halifax's £300,077 average and Zoopla's £269,800 figure isn't a problem to solve—it's a reality to understand.[1] Each index serves different purposes, and professional valuers must synthesize these diverse sources while applying regional intelligence and local market knowledge. The consensus 1-3% growth forecast provides directional guidance, but actual valuations must reflect whether properties sit in high-growth regions (West Midlands, North West, Wales) or constrained markets (London, South East).[1][2]
Key success factors for valuation accuracy in 2026:
✅ Multi-source data synthesis using HM Land Registry, mortgage indices, and regional growth data
✅ Regional adjustment precision applying above or below-average growth based on local conditions
✅ Micro-market analysis considering school catchments, transport links, and neighborhood quality
✅ Robust comparable methodology with time adjustments and property-specific factors
✅ Quality assurance processes validating valuations against multiple indices and reasonableness checks
✅ Technology integration using AVMs and databases while maintaining professional judgment
✅ Risk awareness building resilience into methodology for forecast uncertainty
✅ Professional standards compliance following RICS Red Book requirements and maintaining current knowledge
Actionable Next Steps for Property Professionals
For chartered surveyors seeking to enhance valuation accuracy:
- Audit current methodology against the frameworks presented in this article, identifying gaps in regional adjustment or comparable analysis
- Establish data routines for monthly review of HM Land Registry, Nationwide, Halifax, and regional indices
- Build local intelligence networks through regular contact with estate agents, developers, and professional peers
- Invest in technology by subscribing to professional databases and learning AVM tools
- Document assumptions rigorously in all valuation reports, explaining regional adjustments and growth forecasts
- Implement quality checks using the validation frameworks to ensure valuations withstand scrutiny
- Pursue targeted CPD focusing on regional market dynamics and advanced valuation techniques
For property buyers and sellers:
- Commission professional surveys from qualified chartered surveyors rather than relying solely on online estimates
- Understand index variations when reviewing market data—recognize that different sources serve different purposes
- Consider regional context rather than applying national forecasts to local property decisions
- Request detailed comparables from surveyors to understand valuation reasoning
- Plan for uncertainty by building financial buffers for potential market variations
For mortgage lenders and financial institutions:
- Review valuation panel quality ensuring surveyors demonstrate regional expertise and robust methodology
- Require regional adjustments in valuation reports rather than accepting national growth assumptions
- Implement validation processes cross-checking individual valuations against regional indices
- Monitor micro-market trends in concentrated lending areas to identify emerging risks
- Support surveyor CPD through information sharing and market intelligence
The 2026 UK housing market rewards precision, local knowledge, and methodological rigor. As regional variations intensify and modest growth creates narrow margins for error, Valuation Accuracy in 2026 UK House Price Forecasts: Adjusting for 1-3% Growth and Regional Variations separates professional excellence from mediocrity. Surveyors who embrace sophisticated, multi-source approaches while maintaining RICS standards will deliver the accuracy clients need in an increasingly complex market.
The path forward requires continuous learning, technology adoption, and unwavering commitment to professional standards. By synthesizing lender forecasts, RICS data, regional intelligence, and local market knowledge, chartered surveyors can navigate the uneven national recovery and provide the precision valuations that underpin confident property decisions.
References
[1] House Prices – https://moneyweek.com/investments/house-prices/house-prices
[2] Is Now A Good Time To Buy A House – https://hoa.org.uk/advice/guides-for-homeowners/i-am-buying/is-now-a-good-time-to-buy-a-house/
[3] Watch – https://www.youtube.com/watch?v=qyh_Sl6ZtgI
[4] Ukhpi – https://landregistry.data.gov.uk/app/ukhpi/
[5] Housing – https://www.ons.gov.uk/peoplepopulationandcommunity/housing
[6] Uk House Price Index Reports – https://www.gov.uk/government/collections/uk-house-price-index-reports