
The UK property market in 2026 faces an unprecedented challenge: Southern properties now command premiums of 150-200% over comparable Northern stock[1]. This dramatic regional divide demands sophisticated valuation approaches that go far beyond traditional methods. For surveyors, lenders, and property professionals, understanding Valuation Techniques for Widening North-South Divides: RICS Adjustments for 2026 Regional Price Gaps has become essential for accurate appraisals and sound investment decisions.
The widening gap between North and South isn't just about numbers—it represents fundamental differences in market dynamics, economic opportunities, and property characteristics that require nuanced professional judgment. This guide provides RICS-backed formulas, comparables analysis techniques, and risk adjustments that enable accurate valuations across diverging regional markets.

Key Takeaways
- Southern properties command 150-200% premiums over comparable Northern properties in 2026, requiring specialized adjustment methodologies[1]
- RICS updated professional standards effective January 1, 2026, align with Basel 3.1 frameworks and provide guidance for regional valuation challenges[3]
- Location adjustment factors must account for employment rates, infrastructure investment, and local economic indicators beyond simple geographic differences
- Comparable property analysis requires cross-regional benchmarking with multiple adjustment layers for accurate market value determination
- Risk-adjusted valuations incorporate through-the-cycle modeling to counter pro-cyclical effects in volatile regional markets[3]
Understanding the 2026 North-South Property Divide
The Scale of Regional Price Gaps
The regional property divide in the UK has reached historic proportions in 2026. Southern England properties—particularly in London and the Southeast—now trade at premiums that would have seemed unthinkable just a decade ago. A three-bedroom semi-detached home in Surrey might command £650,000, while an equivalent property in Yorkshire sells for £220,000[1].
This disparity extends beyond simple price differences. The gap reflects:
✅ Economic concentration in Southern regions with higher-paying industries
✅ Infrastructure investment favoring London and surrounding areas
✅ Employment opportunities clustered in financial services and technology sectors
✅ International investment focused predominantly on Southern markets
✅ Educational institutions driving demand in specific Southern locations
Northern England's 2026 Price Surge
Despite the overall North-South divide, Northern England is experiencing a documented 2026 price surge that adds complexity to valuation work[2]. Cities like Manchester, Leeds, and Newcastle have seen significant appreciation driven by:
- Remote work flexibility enabling professionals to relocate from expensive Southern areas
- Government leveling-up initiatives directing infrastructure spending northward
- University expansion creating demand around educational hubs
- Cultural renaissance in Northern cities attracting younger demographics
- Commercial property conversion increasing residential stock in city centers
This Northern recovery creates a dual-market dynamic where valuers must distinguish between stagnant rural Northern areas and thriving urban centers experiencing rapid appreciation.
RICS 2026 Regulatory Updates
The Royal Institution of Chartered Surveyors released updated professional standards for bank lending valuations effective January 1, 2026[3]. These standards fully align with Basel 3.1 and the EU's amended Capital Requirements Regulation (CRR III), providing crucial guidance for valuers navigating regional market divergence.
Professor Neil Crosby of the University of Reading led the standards update, supported by an international expert group representing major industry bodies including CBRE, Colliers, and JLL[3]. The new framework clarifies the relationship between market value, mortgage lending value (MLV), and prudently conservative valuation criteria—particularly important when assessing properties in volatile regional markets.
For professionals seeking comprehensive valuation guidance, our Red Book valuation services ensure full compliance with current RICS standards.
Core Valuation Techniques for Regional Price Gaps

Comparative Market Analysis Across Regions
The foundation of Valuation Techniques for Widening North-South Divides: RICS Adjustments for 2026 Regional Price Gaps lies in sophisticated comparative market analysis. Traditional comparables work breaks down when regional markets diverge so dramatically.
Primary Comparable Selection Criteria:
- Geographic proximity (within 2-mile radius for urban, 5-mile for rural)
- Property type matching (terraced, semi-detached, detached, flat)
- Age and construction quality alignment
- Size equivalence (±15% floor area tolerance)
- Transaction recency (preferably within 6 months)
However, in 2026's divided market, valuers must also apply cross-regional benchmarking to validate local comparables against broader market trends.
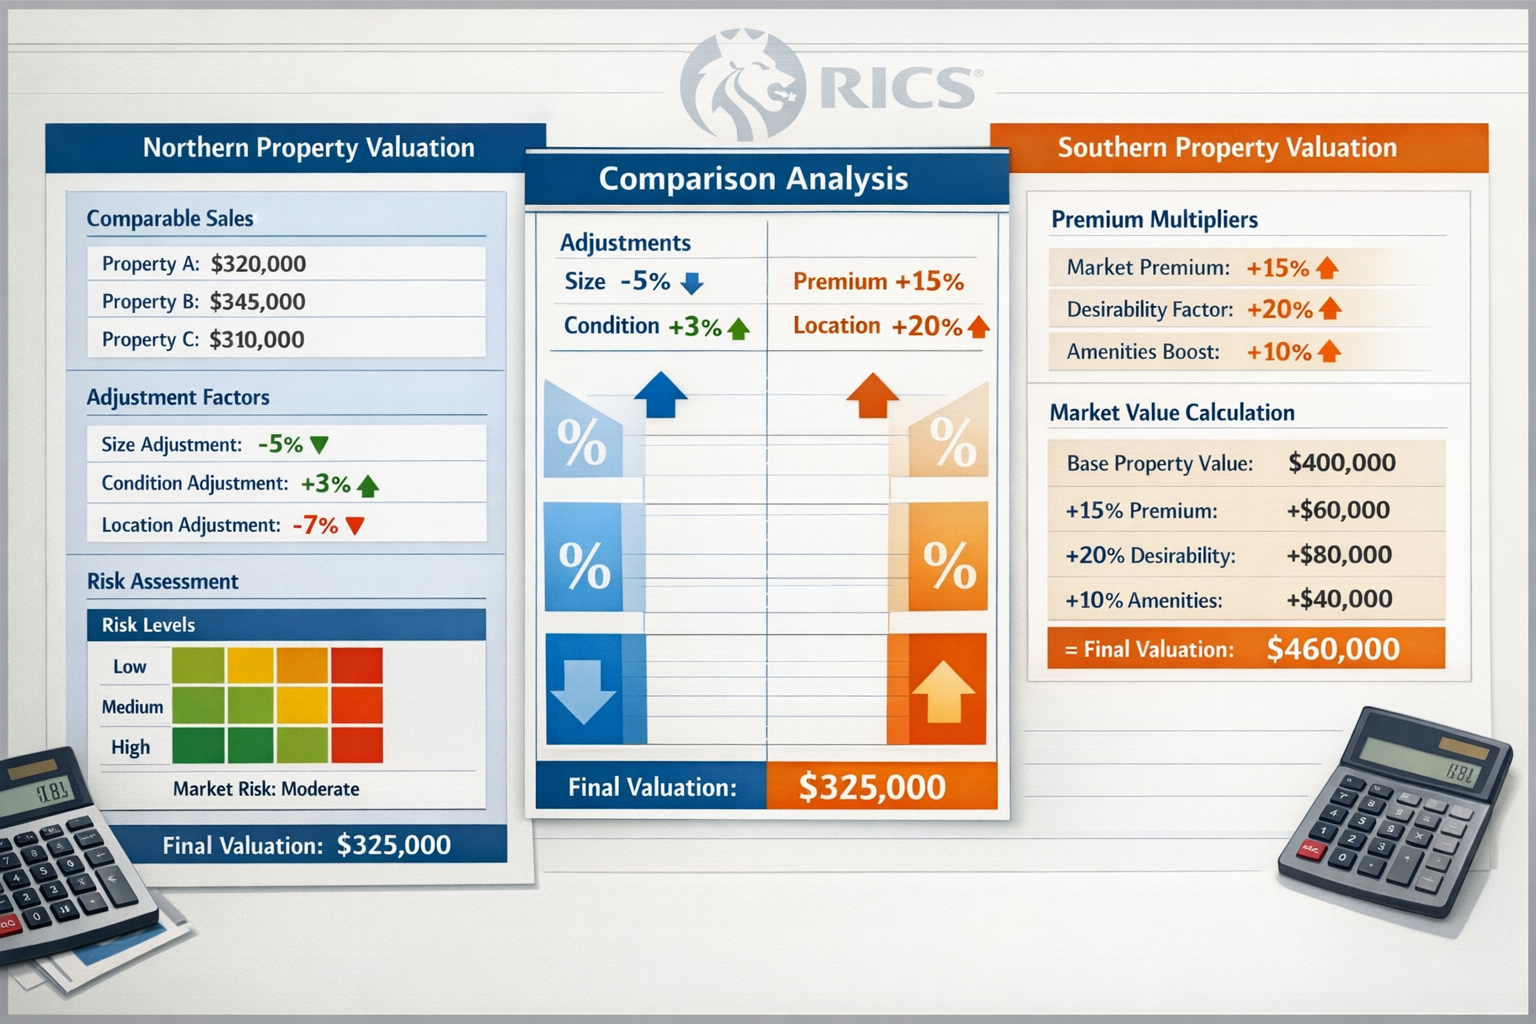
Location Adjustment Factors
Location adjustments in 2026 require multi-layered analysis beyond simple geographic differences. The RICS framework recommends considering:
| Factor | Weight | Measurement |
|---|---|---|
| Employment rate | 25% | Local vs. national average |
| Average income | 20% | Median household earnings |
| Transport links | 15% | Commute time to major centers |
| School quality | 15% | Ofsted ratings within catchment |
| Crime rates | 10% | Police data per 1,000 residents |
| Infrastructure investment | 10% | Planned public spending |
| Amenities access | 5% | Proximity to services |
Example calculation: A property in a Northern town with 8% unemployment (national average 4%) would receive a negative 12% location adjustment on the employment factor alone, which carries 25% weight in the overall location score.
Property Characteristic Adjustments
Beyond location, physical property characteristics require standardized adjustments:
Size adjustments:
- Properties 10-20% larger: +5% per 10% size increase
- Properties 10-20% smaller: -5% per 10% size decrease
- Diminishing returns apply beyond 30% size differential
Condition adjustments:
- Excellent condition: +10% to +15%
- Good condition: +5% to +10%
- Average condition: baseline (0%)
- Below average: -10% to -15%
- Poor condition: -20% to -30%
Age and construction:
- New build premium: +15% to +25%
- Modern (post-2000): +5% to +10%
- Period features (Victorian/Georgian): +10% to +20% in Southern markets
- Pre-1950 without modernization: -5% to -15%
Our valuation factors guide provides additional detail on these characteristic-based adjustments.
Market Condition Adjustments
The 2026 RICS standards emphasize through-the-cycle modeling to counter pro-cyclical effects of market value in volatile periods[3]. This approach requires:
📊 Time-series analysis of regional price movements over 5-10 year periods
📊 Volatility indexing comparing regional standard deviation to national averages
📊 Liquidity assessments measuring average time-to-sale in each region
📊 Transaction volume tracking identifying thin markets requiring additional caution
For properties in rapidly appreciating Northern markets, valuers should apply a sustainability discount of 5-10% to account for potential mean reversion. Conversely, established Southern markets may warrant a stability premium of 3-5%.
RICS-Compliant Adjustment Methodologies for 2026
The Paired Sales Analysis Method
Paired sales analysis provides the most objective foundation for quantifying adjustment factors. This technique compares properties that differ in only one characteristic, isolating the value impact of that specific feature.
Implementation steps:
- Identify property pairs in the same neighborhood sold within 3 months
- Ensure single-variable difference (e.g., one has garage, one doesn't)
- Calculate percentage difference in sale prices
- Repeat across multiple pairs to establish reliable adjustment range
- Apply median adjustment to subject property valuation
Example: Three paired sales in Leeds show properties with off-street parking sold for 8%, 11%, and 9% more than identical properties without parking. The median 9% adjustment becomes the standard for parking in that submarket.
The Regression Analysis Approach
For complex regional markets, multiple regression analysis enables simultaneous consideration of numerous variables. This statistical method determines the independent contribution of each property characteristic to overall value.
Key variables in regional regression models:
- Square footage (continuous variable)
- Number of bedrooms (discrete variable)
- Number of bathrooms (discrete variable)
- Property age (continuous variable)
- Distance to transport hub (continuous variable)
- Regional indicator (categorical: North/Midlands/South)
- Urban/suburban/rural classification (categorical)
Modern valuation software can process thousands of transactions to generate region-specific valuation algorithms that automatically calculate appropriate adjustments. However, professional judgment remains essential to validate algorithmic outputs.
Income Capitalization for Regional Markets
In rental markets, the income approach provides an alternative valuation method particularly useful for cross-regional comparison. The formula:
Property Value = Net Operating Income ÷ Capitalization Rate
Regional cap rates in 2026 vary significantly:
- London prime areas: 3.5% – 4.5%
- Southern England: 4.5% – 5.5%
- Midlands: 5.5% – 6.5%
- Northern England: 6.0% – 7.5%
Higher Northern cap rates reflect perceived risk, lower liquidity, and reduced capital appreciation expectations. When valuing investment properties, applying the appropriate regional cap rate is crucial for accurate assessment.
For specialized valuation scenarios, our RICS Help to Buy valuations service addresses government scheme requirements across all UK regions.
Cost Approach Adjustments
The cost approach—calculating replacement cost minus depreciation—provides a valuation floor, particularly useful for unique properties lacking comparables. Regional adjustments include:
Construction cost variations:
- London and Southeast: +15% to +25% above national average
- Southern regions: +5% to +15% above average
- Midlands: -5% to +5% of average
- Northern regions: -10% to -5% below average
Land value differentials:
- Prime Southern locations: £300-£800 per square meter
- Northern urban areas: £100-£250 per square meter
- Rural Northern areas: £50-£150 per square meter
Mortgage Lending Value (MLV) Framework
The 2026 RICS standards clarify Mortgage Lending Value as distinct from market value[3]. MLV represents a prudently conservative estimate suitable for long-term lending decisions, particularly important in volatile regional markets.
MLV calculation methodology:
- Determine market value using standard comparable analysis
- Apply regional volatility discount (5-15% based on price standard deviation)
- Consider liquidity adjustment (additional 5-10% in thin markets)
- Factor in through-the-cycle sustainability (5% discount in overheated markets)
For a £400,000 property in a rapidly appreciating Northern city with high volatility and moderate liquidity, the MLV might be:
- Market value: £400,000
- Volatility discount (10%): -£40,000
- Liquidity adjustment (7%): -£28,000
- Final MLV: £332,000
This conservative approach protects lenders against regional market corrections while supporting sustainable lending practices.
Practical Application: Regional Valuation Case Studies
Case Study 1: Comparable Northern vs. Southern Properties
Northern Property (Leeds):
- 3-bedroom semi-detached Victorian terrace
- 1,200 square feet
- Good condition, modernized kitchen/bathroom
- Garden, off-street parking
- Sale price: £285,000
Southern Property (Reading):
- 3-bedroom semi-detached Victorian terrace
- 1,150 square feet
- Good condition, modernized kitchen/bathroom
- Garden, off-street parking
- Sale price: £625,000
Adjustment analysis:
| Factor | Adjustment | Impact |
|---|---|---|
| Size difference (+50 sq ft Northern) | +2% | +£12,500 Northern |
| Location (employment/income) | +85% | +£531,250 Southern |
| Transport links (Reading proximity to London) | +15% | +£93,750 Southern |
| Market liquidity | +8% | +£50,000 Southern |
| Total explained premium | ~119% | £340,000 |
This analysis demonstrates how location-based economic factors account for the majority of regional price differentials, with the remaining gap attributable to market sentiment and investment demand.
Case Study 2: Adjusting for Northern Market Recovery
Subject property: 2-bedroom apartment in Manchester city center
Recent comparables:
- Comparable 1 (sold 3 months ago): £210,000
- Comparable 2 (sold 5 months ago): £195,000
- Comparable 3 (sold 8 months ago): £185,000
Market trend analysis shows 2% monthly appreciation in this submarket. Time adjustments:
- Comparable 1: +6% (3 months × 2%) = £222,600
- Comparable 2: +10% (5 months × 2%) = £214,500
- Comparable 3: +16% (8 months × 2%) = £214,600
Adjusted comparable average: £217,233
Additional adjustments for condition, floor level, and parking yield a final valuation of £225,000—significantly higher than the oldest comparable but reflecting genuine market appreciation in recovering Northern urban markets[2].
Case Study 3: Risk-Adjusted Valuation in Volatile Markets
Subject property: 4-bedroom detached home in outer London suburb
Market value assessment: £875,000 based on recent comparables
Risk adjustments for MLV:
- Regional volatility (London 12% standard deviation): -10%
- Sustainability concern (5-year price CAGR of 18%): -8%
- Liquidity (adequate transaction volume): -2%
Mortgage Lending Value calculation:
- Market value: £875,000
- Total risk discount (20%): -£175,000
- MLV: £700,000
This conservative MLV protects the lender against potential market corrections while remaining within RICS 2026 guidelines for prudent valuation[3].
For comprehensive property assessments, our RICS Building Surveys Level 3 service provides detailed condition analysis supporting accurate valuations.
Technology and Data Sources for Regional Valuations
Essential Data Sources
Accurate Valuation Techniques for Widening North-South Divides: RICS Adjustments for 2026 Regional Price Gaps require access to comprehensive, current data:
Property transaction databases:
- 🏠 Land Registry Price Paid Data (free, comprehensive UK coverage)
- 🏠 Rightmove and Zoopla (asking prices, market trends)
- 🏠 EPC Register (energy efficiency, property characteristics)
- 🏠 CoStar (commercial property data)
Economic indicators:
- 📈 ONS Regional Economic Statistics (employment, income, GDP)
- 📈 Bank of England Regional Data (lending volumes, mortgage approvals)
- 📈 HMRC Stamp Duty Statistics (transaction volumes by region)
Local market intelligence:
- 🔍 Council planning applications (development pipeline)
- 🔍 Transport infrastructure announcements (HS2, Crossrail extensions)
- 🔍 School performance data (Ofsted ratings, league tables)
- 🔍 Crime statistics (Police.uk data)
Valuation Software Solutions
Modern valuation platforms incorporate automated comparable selection and adjustment algorithms:
Leading solutions:
- RICS Valuer (official RICS platform with Red Book compliance)
- Argus (commercial property valuation and analysis)
- CoStar Suite (comprehensive market data and valuation tools)
- PropertyData (UK-specific analytics and comparable search)
These platforms enable valuers to process thousands of comparables simultaneously, identifying patterns and adjustment factors across regional markets. However, professional judgment remains irreplaceable for validating algorithmic outputs and applying qualitative factors.
Geographic Information Systems (GIS)
GIS mapping technology enhances regional valuation by visualizing:
- Heat maps of price per square foot across neighborhoods
- Proximity analysis to transport, schools, amenities
- Demographic overlays (income, education, age distribution)
- Planning and zoning information
- Environmental factors (flood risk, air quality)
Advanced valuers use GIS to identify micro-market boundaries where property values shift dramatically across street boundaries—common in areas where Northern and Southern market characteristics overlap.
Challenges and Limitations in Regional Valuation
Data Scarcity in Thin Markets
Some Northern rural areas suffer from insufficient transaction volumes to establish reliable comparable databases. When fewer than 5 transactions occur annually in a specific property category, valuers must:
✔️ Expand geographic search radius while applying location adjustments
✔️ Extend time period for comparables (up to 18 months with trend adjustments)
✔️ Use alternative property types with conversion factors
✔️ Apply cost approach as secondary validation method
Rapid Market Changes
The documented Northern price surge[2] creates challenges for backward-looking comparable analysis. Properties sold 6 months ago may no longer reflect current market conditions in rapidly appreciating areas.
Solutions:
- Apply monthly trend adjustments based on regional house price indices
- Weight recent comparables more heavily in final valuation
- Conduct forward-looking analysis incorporating planned infrastructure and development
- Use pending sales data (under offer properties) as leading indicators
Subjective Adjustment Factors
Despite best efforts at objectivity, certain adjustments require professional judgment:
- View quality and orientation
- Street appeal and neighborhood character
- Proximity to nuisances (busy roads, commercial properties)
- Future development potential
- Intangible desirability factors
Experienced valuers develop calibrated judgment through years of market observation, but these subjective elements introduce variability between different valuers assessing the same property.
For complex valuation scenarios requiring expert analysis, our chartered surveyors across London provide region-specific expertise.
Regulatory Compliance Complexity
The 2026 RICS standards[3] introduce additional complexity through:
- Multiple valuation bases (market value vs. MLV vs. investment value)
- Enhanced documentation requirements for adjustment justification
- Through-the-cycle modeling expectations for lender valuations
- Basel 3.1 alignment affecting acceptable risk parameters
Valuers must maintain comprehensive working files documenting every adjustment decision and supporting rationale—essential for professional indemnity protection and regulatory compliance.
Best Practices for Accurate Regional Valuations
Comprehensive Market Research
Before beginning any valuation, conduct thorough regional market research:
- Review 12-month transaction history in the subject property's immediate area
- Analyze regional economic trends (employment, wage growth, business investment)
- Identify infrastructure developments affecting future desirability
- Assess local planning applications indicating supply changes
- Monitor regional house price indices for trend direction
This contextual understanding enables informed adjustment decisions grounded in market fundamentals rather than superficial price comparisons.
Multiple Valuation Approaches
The RICS Red Book recommends triangulation using multiple valuation methods:
Primary approach: Comparable sales analysis with regional adjustments
Secondary validation: Income approach (for rental properties)
Tertiary check: Cost approach (for unique properties)
When all three approaches yield similar values (within 10%), confidence in the valuation increases significantly. Divergent results signal the need for additional investigation and adjustment refinement.
Documentation and Transparency
The 2026 standards emphasize comprehensive documentation[3]:
📋 Comparable selection rationale (why specific properties were chosen)
📋 Adjustment calculations (detailed math for each factor)
📋 Market trend analysis (supporting time-based adjustments)
📋 Risk assessment (volatility, liquidity, sustainability concerns)
📋 Limitations and assumptions (data constraints, market uncertainties)
Thorough documentation protects against professional liability claims and enables lenders to understand valuation methodology and confidence levels.
Continuing Professional Development
Regional markets evolve rapidly, requiring ongoing education:
- Attend RICS regional market briefings and webinars
- Review quarterly house price reports from major indices
- Participate in local valuer networks and peer discussions
- Study planning and infrastructure announcements
- Monitor economic indicators and forecasts
The most accurate valuers maintain current market knowledge rather than relying solely on historical patterns and outdated adjustment factors.
For specialized scenarios like shared ownership properties, our shared ownership valuation service applies appropriate methodologies for this unique property category.
Future Outlook: Regional Markets Beyond 2026
Emerging Trends Affecting Valuations
Several developments will impact Valuation Techniques for Widening North-South Divides: RICS Adjustments for 2026 Regional Price Gaps in coming years:
Leveling-up initiatives: Government infrastructure spending in Northern regions may narrow price gaps in specific urban centers while widening rural-urban divides within regions.
Remote work normalization: Continued flexibility in work arrangements enables Southern professionals to relocate northward, potentially compressing regional premiums while creating new micro-market hotspots.
Climate change considerations: Flood risk, coastal erosion, and extreme weather events will increasingly factor into regional valuations, potentially disadvantaging certain Southern coastal areas while benefiting Northern inland locations.
Demographic shifts: Aging populations in Southern regions may reduce demand growth while younger demographics concentrate in affordable Northern cities with universities and cultural amenities.
Technology Disruption
Artificial intelligence and machine learning will transform valuation methodologies:
- Automated comparable selection with superior pattern recognition
- Real-time market trend analysis incorporating multiple data streams
- Predictive modeling for forward-looking valuations
- Image recognition for property condition assessment
- Natural language processing of planning documents and market reports
However, human expertise remains essential for interpreting results, applying professional judgment, and validating algorithmic outputs—particularly in unusual or complex scenarios.
Regulatory Evolution
RICS standards will continue evolving to address:
- Climate risk integration into valuation frameworks
- Enhanced sustainability metrics affecting property values
- Digital property rights (virtual elements, data infrastructure)
- Cross-border harmonization with international valuation standards
Valuers must stay current with regulatory developments to maintain professional competence and compliance.
Conclusion
The Valuation Techniques for Widening North-South Divides: RICS Adjustments for 2026 Regional Price Gaps represent a critical competency for property professionals navigating the UK's increasingly divergent regional markets. With Southern properties commanding 150-200% premiums over comparable Northern stock[1], sophisticated adjustment methodologies have become essential for accurate appraisals.
The 2026 RICS standards[3] provide a robust framework incorporating Basel 3.1 alignment, through-the-cycle modeling, and prudent risk adjustments. By combining comparative market analysis, location-specific adjustment factors, and multiple valuation approaches, professionals can deliver reliable valuations that serve lenders, buyers, and investors across all UK regions.
Actionable Next Steps
For property professionals seeking to enhance regional valuation accuracy:
✅ Update methodology frameworks to incorporate 2026 RICS standards and MLV calculations
✅ Invest in comprehensive data sources providing regional transaction, economic, and planning information
✅ Develop region-specific adjustment matrices based on paired sales analysis and regression modeling
✅ Implement quality control processes requiring multiple valuation approaches for cross-validation
✅ Pursue continuing education on regional market trends and emerging valuation technologies
For property owners, buyers, and investors:
✅ Engage RICS-qualified valuers with demonstrated regional expertise and current accreditation
✅ Request detailed adjustment documentation explaining how regional factors influenced final valuations
✅ Consider multiple valuation opinions for high-value or complex properties
✅ Understand the difference between market value and mortgage lending value for financing decisions
✅ Monitor regional market trends affecting property values in your area of interest
The North-South divide shows no signs of narrowing in the immediate future, making regional valuation expertise increasingly valuable. Whether you're a professional surveyor, lender, or property stakeholder, understanding these sophisticated techniques ensures informed decision-making in the UK's complex and divergent regional property markets.
For expert RICS-compliant valuations across all UK regions, contact our team of chartered surveyors who combine local market knowledge with advanced valuation methodologies tailored to 2026's challenging regional dynamics.
References
[1] Valuing North Vs South Uk Properties In 2026 Surveyor Techniques For Diverging Regional Markets – https://nottinghillsurveyors.com/blog/valuing-north-vs-south-uk-properties-in-2026-surveyor-techniques-for-diverging-regional-markets
[2] Valuation Strategies For Northern Englands 2026 Price Surge Rics Techniques Amid Regional Recovery – https://nottinghillsurveyors.com/blog/valuation-strategies-for-northern-englands-2026-price-surge-rics-techniques-amid-regional-recovery
[3] Rics Updates Global Guidance On Bank Lending Valuations With Two Key Publications – https://www.rics.org/news-insights/rics-updates-global-guidance-on-bank-lending-valuations-with-two-key-publications