
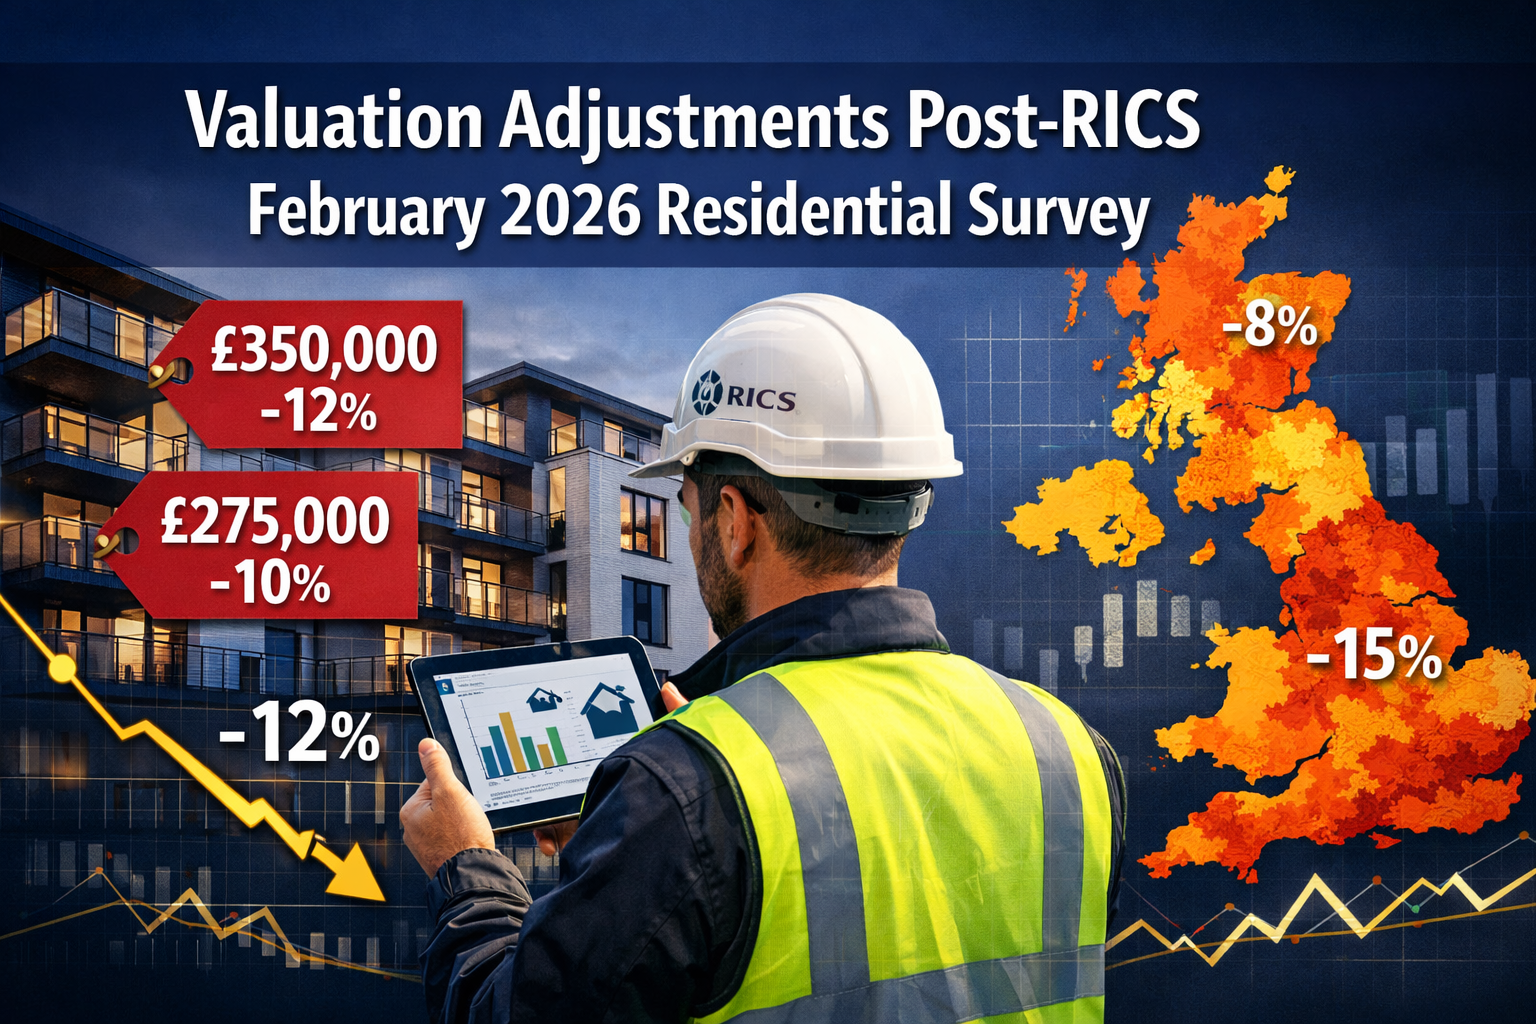
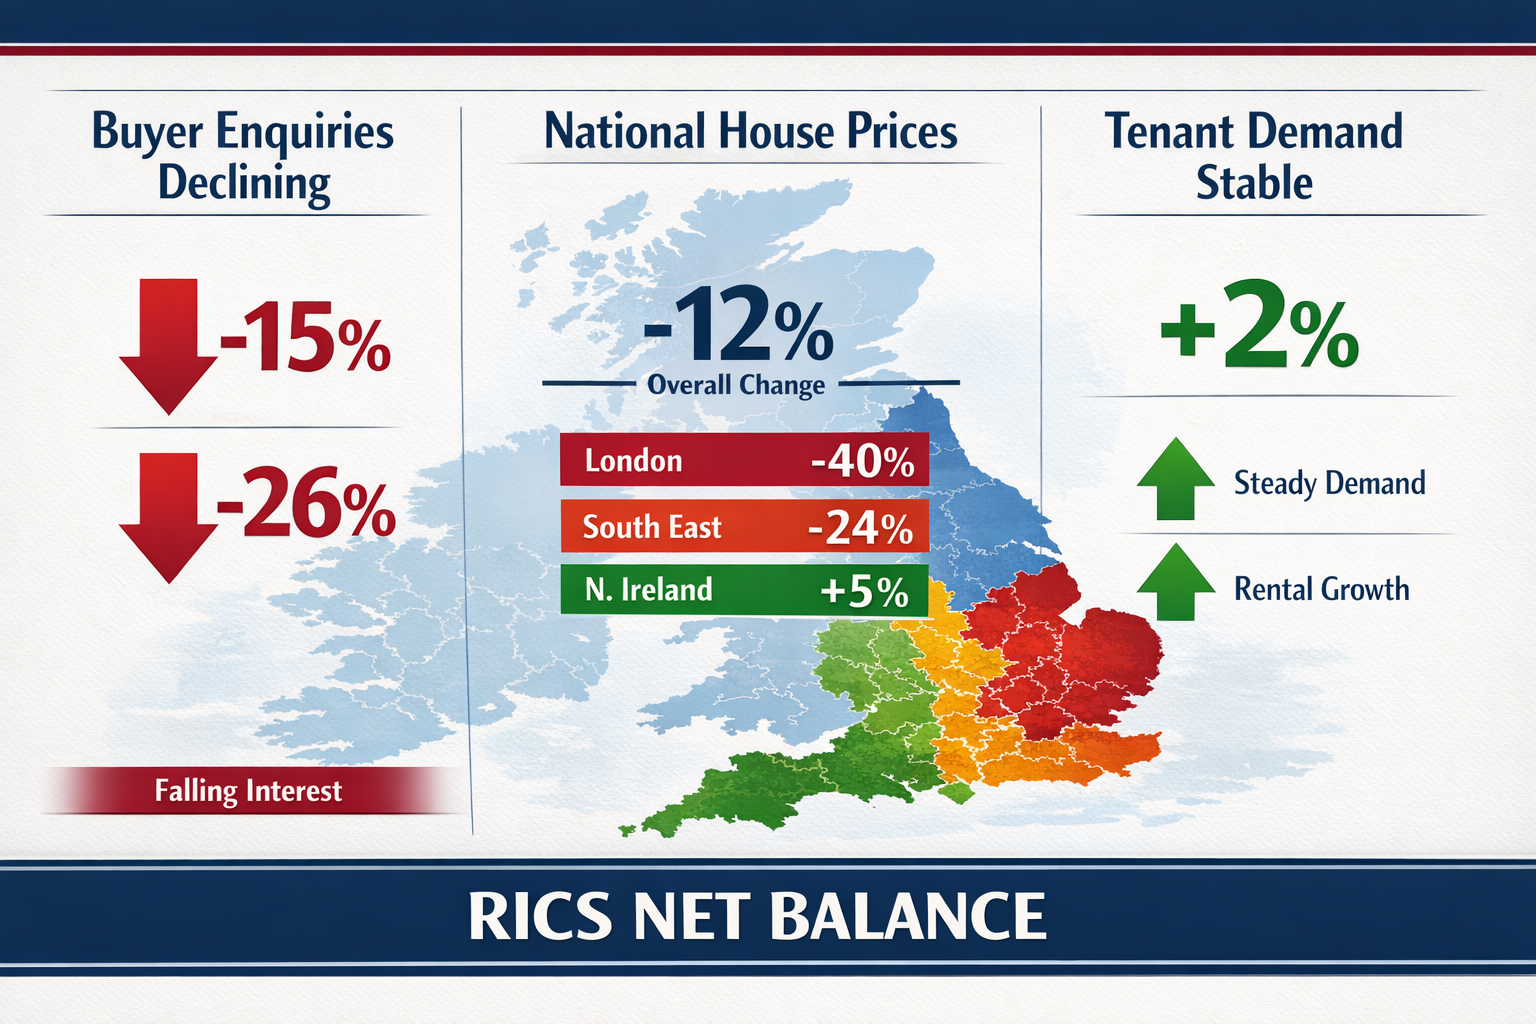
The RICS February 2026 Residential Survey has delivered a stark reality check: national house prices registered a net balance of -12%, buyer enquiries plummeted to -26%, yet tenant demand held remarkably steady at +2%[1][2]. This unusual combination of flat capital values alongside stable lettings demand creates a complex valuation landscape that demands precision, regional awareness, and adaptive methodologies from chartered surveyors and property professionals navigating 2026's uncertain market conditions.
Understanding Valuation Adjustments Post-RICS February 2026 Residential Survey: Strategies for Flat Prices and Stable Lettings Demand is essential for property investors, homeowners, and professionals who need accurate appraisals amid geopolitical uncertainty, divergent regional trends, and the ongoing supply crisis in the rental sector. The data reveals not just national trends but profound regional disparities that fundamentally alter valuation approaches.
Key Takeaways
- 📉 National house prices remained flat at -12% net balance in February 2026, but regional divergence is extreme, with London down -40% while Northern regions show resilience[1][2]
- 🏘️ Buyer enquiries declined sharply to -26% in February (worsening to -39% by March), requiring valuers to adjust comparable sales timeframes and weight recent transactions more heavily[1]
- 🏢 Tenant demand stayed stable at +2%, while landlord instructions fell to -27%, creating upward rental pressure (+20% expecting rises) that supports investment property valuations despite weak capital growth[1][2]
- 🌍 Geopolitical and macroeconomic uncertainty intensified throughout early 2026, with inflation concerns and energy price volatility extending mortgage rate pressure and dampening near-term price expectations to -18%[1][2]
- 📊 12-month price expectations remain moderately positive at +33%, providing some support for longer-term valuation assumptions beyond immediate market weakness[1][2]
Understanding the RICS February 2026 Net Balance Data
The concept of net balance forms the foundation of RICS residential survey interpretation. Rather than absolute numbers, net balance represents the difference between the percentage of respondents reporting increases versus decreases. A reading of -12% for house prices means 12% more surveyors reported price falls than rises—a critical distinction that signals market direction without magnitude[1][2].
Decoding the February 2026 Headline Figures
The February 2026 survey revealed several key net balance metrics that directly impact valuation strategies:
| Metric | Net Balance | Interpretation | Valuation Impact |
|---|---|---|---|
| National House Prices | -12% | Broadly flat with slight downward bias | Apply conservative adjustments to recent comparables |
| Buyer Enquiries | -26% (Feb), -39% (Mar) | Sharp decline in demand | Weight recent sales heavily; expect longer marketing periods |
| Agreed Sales | -12% | Subdued transaction activity | Reduce comparable pool; increase scrutiny of outliers |
| Near-Term Sales Expectations | -2% | Weakest since November 2025 | Apply short-term negative adjustments (3-6 months) |
| Tenant Demand | +2% | Stable lettings market | Support investment valuations with rental income stability |
| Landlord Instructions | -27% | Acute supply shortage | Upward pressure on rental valuations |
| New Property Instructions | +2% | Stable supply pipeline | Maintain baseline valuation assumptions for supply |
These figures paint a picture of a bifurcated market where capital values face headwinds while rental fundamentals remain robust[1][2]. For professional valuers, this requires dual-track analysis depending on the property's intended use.
Regional Divergence: The Critical Valuation Variable
Perhaps the most significant finding from the February 2026 survey is the extreme regional variation in price trends. While the national headline showed -12%, this masks dramatic differences[1]:
Severely Impacted Regions:
- 🔴 London: -40% net balance (dramatic deterioration from previous surveys)
- 🔴 South East: -24% net balance
- 🔴 East Anglia: -26% net balance
Resilient Regions:
- 🟢 Northern Ireland: Positive price momentum continues
- 🟢 Scotland: Firmer price trends maintained
- 🟢 North West England: Outperforming national average
This divergence means valuers cannot apply uniform methodologies across the UK. A property in London requires fundamentally different comparable selection, adjustment factors, and risk assessments than one in Northern Ireland. The valuation types employed must reflect these regional realities.
Valuation Adjustment Strategies for Flat Price Environments
When markets exhibit flat or slightly negative price trends, as evidenced by the -12% national net balance, valuers face unique challenges. Traditional comparable sales approaches require refinement to account for time-based adjustments, market sentiment shifts, and liquidity constraints[3].
Time-Adjusted Comparable Analysis
In flat markets, the temporal relevance of comparable sales becomes paramount. The February 2026 RICS data shows buyer enquiries deteriorating from -15% in January to -26% in February, then plummeting to -39% by March[1]. This rapid sentiment shift means:
Best Practice Adjustments:
- Prioritize recent transactions (last 3 months) over older comparables
- Apply time decay factors of 0.5-1.5% per month to comparables older than 90 days in declining sentiment environments
- Weight agreed sales from the current quarter more heavily than completed transactions from previous quarters
- Discount comparables from before January 2026 by an additional 2-3% to reflect the sentiment deterioration
The RICS guidance on Red Book valuation standards emphasizes the importance of temporal adjustments when market conditions are changing rapidly, as they clearly were in early 2026[3].
Handling Low Transaction Volumes
With agreed sales at -12% net balance and near-term sales expectations at -2% (the weakest since November 2025), valuers face a reduced pool of comparable evidence[1][2]. This scarcity requires:
✅ Expanded geographical search parameters while maintaining comparability standards
✅ Increased reliance on asking price data with appropriate discounts (typically 3-5% in weak markets)
✅ Greater weight on rental yields for investment properties, using capitalization rate approaches
✅ Enhanced qualitative analysis of property-specific features that may command premiums despite market weakness
When working with chartered surveyors in central London, expect more conservative valuations that reflect the -40% London-specific net balance rather than the -12% national figure[1].
Incorporating Geopolitical and Macroeconomic Uncertainty
The February 2026 survey explicitly noted intensifying headwinds including inflation concerns, global instability, and rising oil and energy prices extending mortgage rate pressure[1][2]. These macro factors require explicit consideration in valuation reports:
Risk Adjustment Framework:
- Base valuation: Derived from comparable sales with time adjustments
- Macro risk discount: 2-5% depending on property type and location
- Liquidity adjustment: Additional 1-3% for properties in severely impacted regions (London, South East)
- Uncertainty premium: Wider valuation ranges (±5-7% rather than typical ±3-5%)
Professional valuers should document these adjustments transparently, referencing the RICS survey data as supporting evidence for conservative approaches during periods of heightened uncertainty[3].
Regional Valuation Strategies: Adapting to Local Market Dynamics
The Valuation Adjustments Post-RICS February 2026 Residential Survey: Strategies for Flat Prices and Stable Lettings Demand must account for the unprecedented regional divergence revealed in the data. A one-size-fits-all approach is no longer viable when London shows -40% while Northern Ireland remains positive[1][2].
London and South East: Managing Severe Downward Pressure
The capital and its surrounding regions experienced the most severe valuation headwinds in February 2026. London's 12-month price expectations collapsed to +7% from +56% in the previous survey—a dramatic sentiment shift[1][2].
London-Specific Valuation Protocols:
- Apply location-specific adjustments of -3% to -5% beyond standard comparable analysis
- Prioritize post-January 2026 transactions exclusively when available
- Increase scrutiny of premium property features that may not command expected premiums in weak markets
- Consider dual valuation scenarios: current market value vs. stabilized value (12-18 months forward)
- Weight rental yield analysis more heavily for investment properties, given stable lettings demand
For properties requiring RICS shared ownership valuations in London, expect additional complexity as shared ownership schemes may show different resilience patterns than the general market.
Northern Regions: Capturing Relative Strength
While London struggled, Northern Ireland, Scotland, and the North West of England continued to show firmer price trends[1]. Valuers in these regions should:
✅ Maintain standard comparable methodologies without excessive discounting
✅ Apply modest positive adjustments (0.5-1% per quarter) for properties in high-demand micro-markets
✅ Recognize supply constraints that may support prices despite national weakness
✅ Avoid over-extrapolating London's weakness to resilient regions
The regional variation means that chartered surveyors in Surrey will apply fundamentally different methodologies than those in Bromley or Ealing, even within the greater London area.
Micro-Market Analysis: Beyond Regional Averages
Even within regions showing negative net balances, specific micro-markets may demonstrate resilience. Valuers should:
Conduct granular analysis at the postcode or neighborhood level, identifying:
- Areas with strong transport links or regeneration projects
- Neighborhoods with superior school catchments
- Locations with limited new supply pipelines
- Communities with demographic tailwinds (e.g., young professional influx)
This micro-market focus becomes especially critical when conducting help to buy valuations, where government support schemes may create localized demand patterns that diverge from broader regional trends.
Lettings Market Valuation: Leveraging Stable Demand and Supply Constraints
Perhaps the most significant opportunity revealed in the Valuation Adjustments Post-RICS February 2026 Residential Survey: Strategies for Flat Prices and Stable Lettings Demand lies in the rental sector. While capital values stagnated, the lettings market showed fundamentally different dynamics[1][2].
Understanding the Rental Market Fundamentals
The February 2026 data revealed a structural imbalance in the rental sector:
📊 Key Lettings Metrics:
- Tenant demand: +2% net balance (stable and positive)
- Landlord instructions: -27% net balance (severe supply shortage)
- Near-term rent expectations: +20% of respondents expecting increases
- Three-month rental price trend: Continued upward pressure[1][2]
This combination of stable demand and constrained supply creates a landlord's market that directly impacts investment property valuations, even as capital values face headwinds.

Investment Property Valuation Strategies
For buy-to-let properties and rental investments, the February 2026 survey supports income-based valuation approaches over pure comparable sales methods:
Rental Yield Capitalization Approach:
- Establish market rent: Use current letting comparables, adjusted upward by 2-3% to reflect the +20% expecting increases[1][2]
- Determine net operating income: Deduct typical landlord costs (maintenance, insurance, void periods, management fees)
- Select capitalization rate: Apply 4-6% depending on property type, location, and tenant quality
- Calculate investment value: NOI ÷ Cap Rate = Investment Value
Example Calculation:
- Market rent: £2,000/month = £24,000/year
- Net operating income (after 25% costs): £18,000
- Capitalization rate: 5%
- Investment value: £18,000 ÷ 0.05 = £360,000
This income-focused approach may yield higher valuations than comparable sales methods in markets where capital values are flat but rental income is growing—precisely the scenario revealed in February 2026[1][2].
Supply Shortage Premium
The -27% net balance for landlord instructions represents a structural supply constraint that valuers should recognize as a value-supporting factor[1][2]. Properties with strong rental characteristics deserve premiums:
Rental-Premium Features:
- 🏠 Properties in high-demand rental locations (near universities, transport hubs, employment centers)
- 🏠 Well-maintained properties requiring minimal landlord investment
- 🏠 Properties with existing, quality tenants on favorable lease terms
- 🏠 Flats in buildings with low service charges and good management
When conducting matrimonial valuations or other specialized appraisals, the rental income potential may significantly influence settlement negotiations, especially when one party intends to retain the property as an investment.
Long-Term Rental Market Outlook
While the February 2026 survey showed near-term price expectations turning negative (-18%), the 12-month outlook remained moderately positive at +33%[1][2]. For rental properties, this suggests:
✅ Short-term rental income growth likely to outpace capital appreciation
✅ Total return profiles for buy-to-let remaining attractive despite flat capital values
✅ Defensive investment characteristics as rental demand proves resilient to economic headwinds
✅ Potential capital value recovery in the medium term (12-18 months) as supply constraints persist
Investors seeking RICS help to buy valuation services should consider the dual-use potential of properties that could serve as either owner-occupied homes or rental investments, maximizing flexibility in uncertain markets.
RICS Valuation Techniques for Uncertainty and Market Volatility
The geopolitical and macroeconomic uncertainty that intensified through early 2026 requires valuers to adopt robust methodologies that acknowledge market volatility while maintaining professional standards[3].
Scenario-Based Valuation Approaches
Rather than single-point valuations, RICS best practice in volatile markets suggests scenario modeling:
Three-Scenario Framework:
-
Base Case (60% probability weight)
- Assumes market conditions similar to February 2026 persist for 6-9 months
- National prices remain flat (-12% net balance)
- Regional divergence continues
- Rental market fundamentals stay supportive
-
Downside Case (25% probability weight)
- Buyer enquiries continue deteriorating beyond -39%
- Near-term price expectations materialize (-18% over 3 months)
- Mortgage rate pressure intensifies
- Transaction volumes fall further
-
Upside Case (15% probability weight)
- Geopolitical uncertainty eases
- Interest rate trajectory improves
- 12-month positive expectations (+33%) begin materializing sooner
- Supply constraints drive price recovery in undersupplied regions
Probability-Weighted Valuation = (Base × 0.60) + (Downside × 0.25) + (Upside × 0.15)
This approach provides clients with transparent risk assessment while maintaining defensible valuation conclusions that reflect the February 2026 market realities[3].
Sensitivity Analysis and Valuation Ranges
Given the -18% near-term price expectations contrasting with +33% 12-month outlook, valuers should present sensitivity analyses showing how valuations respond to key variable changes[1][2]:
Key Variables for Sensitivity Testing:
- ⚙️ Interest rate movements (±0.5% on mortgage rates)
- ⚙️ Time to sale (3, 6, 9, 12 months)
- ⚙️ Regional price trend variations (±5% from base case)
- ⚙️ Rental yield changes (±0.5% on capitalization rates)
Presenting valuations as ranges rather than single points (e.g., £450,000-£480,000 rather than £465,000) better reflects market uncertainty while maintaining professional credibility.
Documentation and Professional Skepticism
The February 2026 RICS survey data provides valuers with authoritative market evidence to support conservative approaches. Valuation reports should:
📋 Explicitly reference the RICS February 2026 survey findings
📋 Document regional-specific adjustments with clear rationale
📋 Explain time-based comparable adjustments in detail
📋 Acknowledge uncertainty and its impact on valuation confidence
📋 Provide clear assumptions about holding periods, market recovery, and risk factors
This level of documentation protects valuers from hindsight bias if market conditions deteriorate further while demonstrating professional diligence to clients and regulators[3].
For specialized valuations such as RICS reinstatement cost valuation or ATED valuation, the February 2026 market context may influence assumptions about rebuild costs, land values, and depreciation factors.
Practical Implementation: Valuation Adjustments in Action
Translating the Valuation Adjustments Post-RICS February 2026 Residential Survey: Strategies for Flat Prices and Stable Lettings Demand into practical workflows requires systematic integration of survey findings into daily valuation practice.
Step-by-Step Valuation Workflow
Phase 1: Regional Context Assessment
- Identify property location and applicable regional net balance from RICS survey
- Determine if property falls in severely impacted region (London -40%, South East -24%) or resilient region (Northern Ireland, Scotland, North West positive)[1]
- Establish baseline adjustment factor: -3% to -5% for severely impacted, neutral for resilient regions
Phase 2: Comparable Selection and Adjustment
- Gather comparable sales from last 3-6 months, prioritizing post-January 2026 transactions
- Apply time decay adjustments: 0.5-1.5% per month for comparables older than 90 days
- Adjust for transaction volume weakness: apply 1-2% liquidity discount in low-volume markets
- Make standard adjustments for size, condition, location micro-factors
Phase 3: Market Sentiment Integration
- Consider buyer enquiry trend (-26% in February, -39% in March) when estimating marketing period[1]
- Apply near-term expectation adjustment (-18%) for properties requiring quick sale
- Document 12-month outlook (+33%) for properties with flexible sale timelines[1][2]
Phase 4: Investment Property Overlay
- For rental properties, calculate rental yield-based valuation separately
- Consider tenant demand stability (+2%) and supply shortage (-27% landlord instructions)[1][2]
- Apply rental growth expectations (+20% expecting increases) to forward rental income projections
- Weight income-based valuation more heavily (60-70%) versus comparable sales (30-40%) for investment properties
Phase 5: Risk Adjustment and Reporting
- Apply macro risk discount (2-5%) for geopolitical and economic uncertainty
- Present valuation as range reflecting uncertainty (±5-7%)
- Document all adjustments with explicit reference to RICS February 2026 data
- Provide scenario analysis if appropriate for high-value or complex properties
This systematic approach ensures consistency, defensibility, and professional rigor while adapting to the unique market conditions revealed in the February 2026 survey.
Technology and Data Integration
Modern valuation practice increasingly relies on automated valuation models (AVMs) and data analytics platforms. However, the February 2026 market conditions highlight the limitations of purely algorithmic approaches:
⚠️ AVM Limitations in Volatile Markets:
- Historical data may not capture rapid sentiment shifts (-15% to -26% to -39% in three months)[1]
- Regional divergence requires manual override of national models
- Rental market dynamics not typically captured in capital value AVMs
- Geopolitical uncertainty requires qualitative judgment beyond data analysis
Best Practice: Use AVMs as starting points but apply manual adjustments based on RICS survey insights, particularly for regional variations and rental property valuations. The combination of data-driven baselines and professional judgment delivers optimal results.
Client Communication and Expectation Management
The bifurcated market revealed in February 2026—flat capital values but strong rental fundamentals—requires clear client communication:
For Sellers and Buyers:
- Explain that -12% net balance means flat prices, not 12% declines
- Highlight regional variations and their specific impact on the subject property
- Manage expectations around marketing periods given -26% buyer enquiry trend[1][2]
- Present 12-month outlook (+33%) to provide longer-term perspective
For Landlords and Investors:
- Emphasize stable tenant demand (+2%) and supply shortage (-27%)[1][2]
- Highlight rental growth prospects (+20% expecting increases)
- Explain total return profile (income + capital) rather than capital growth alone
- Position rental properties as defensive assets in uncertain markets
For Lenders and Financial Institutions:
- Provide robust documentation of valuation adjustments
- Explain scenario-based approaches and sensitivity analyses
- Reference authoritative RICS survey data to support conservative valuations
- Highlight regional risk variations and portfolio implications
Effective communication ensures all parties understand not just the valuation conclusion but the methodology, assumptions, and market context that underpin it—critical for maintaining professional credibility in volatile markets.
Conclusion
The Valuation Adjustments Post-RICS February 2026 Residential Survey: Strategies for Flat Prices and Stable Lettings Demand reveals a UK property market in transition, characterized by flat capital values, sharp regional divergence, and resilient rental fundamentals. The -12% national house price net balance masks dramatic variations from London's -40% to Northern Ireland's positive momentum, while tenant demand remained stable at +2% despite landlord instructions falling to -27%[1][2].
For property valuers, investors, and homeowners navigating 2026's uncertain landscape, several strategic imperatives emerge:
🎯 Adopt regional-specific methodologies that reflect local market dynamics rather than national averages
🎯 Prioritize recent comparable transactions and apply time-based adjustments to account for rapidly changing sentiment
🎯 Weight rental income analysis more heavily for investment properties, capitalizing on supply constraints and stable tenant demand
🎯 Embrace scenario-based valuations and sensitivity analyses that acknowledge geopolitical and macroeconomic uncertainty
🎯 Document adjustments rigorously, referencing authoritative RICS survey data to support professional conclusions
The contrast between near-term price expectations (-18%) and 12-month outlook (+33%) suggests a market in temporary pause rather than structural decline[1][2]. For patient investors and strategic buyers, the current environment may present opportunities, particularly in the rental sector where supply shortages and stable demand create favorable fundamentals.
Next Steps for Property Professionals
For Chartered Surveyors:
- Review and update valuation methodologies to incorporate February 2026 RICS findings
- Enhance regional market intelligence gathering, particularly for severely impacted areas
- Invest in rental market data and capitalization rate benchmarking
- Consider additional professional development on valuation in uncertain markets
For Property Investors:
- Reassess portfolio valuations using updated methodologies that reflect current market realities
- Consider shifting focus toward rental income generation over capital appreciation in the near term
- Evaluate regional diversification opportunities, particularly in resilient Northern markets
- Consult with chartered surveyors for independent valuation assessments
For Homeowners and Buyers:
- Obtain professional valuations that incorporate February 2026 market conditions before making major decisions
- Understand regional context and how local market dynamics differ from national trends
- Consider longer-term holding periods (12+ months) to benefit from moderately positive outlook
- Explore dual-use potential of properties that could serve as rental investments if needed
The February 2026 RICS Residential Survey provides invaluable market intelligence that, when properly interpreted and applied, enables accurate valuations even amid flat prices, geopolitical uncertainty, and regional divergence. By combining rigorous methodology, authoritative data, and professional judgment, property professionals can navigate this challenging environment while maintaining the highest standards of valuation practice.
References
[1] Uk Residential Survey February 2026 – https://www.rics.org/news-insights/uk-residential-survey-february-2026
[2] Uk Residential Market Survey February 2026 – https://www.rics.org/content/dam/ricsglobal/documents/market-surveys/uk-residential-market-survey/UK-Residential-Market-Survey_February-2026.pdf
[3] Real Estate Valuation Extreme Conditions – https://ww3.rics.org/uk/en/journals/property-journal/real-estate-valuation-extreme-conditions.html
[4] Valuation Impacts Of February 2026 Rics Survey Strategies For Regional Price Divergence In Uk Markets – https://nottinghillsurveyors.com/blog/valuation-impacts-of-february-2026-rics-survey-strategies-for-regional-price-divergence-in-uk-markets