
Over 70% of planning objections on development projects stem from conflicts that were already visible in the available spatial data — they were simply never combined into one place. That is the core problem that GIS Integration for Property Surveyors: Overlaying Data for Smarter Land Use Decisions in 2026 is designed to solve. By stacking zoning maps, utility networks, environmental constraints, and precise survey boundaries into a single, coordinated GIS project, property surveyors can surface those conflicts before they become costly delays.
This step-by-step guide walks through exactly how to build that multi-layer GIS workflow, how to visualize the results for client reports, and how to stay ahead of the skills curve that the industry now demands. Understanding what a chartered surveyor does is the starting point — but mastering GIS is increasingly what separates good surveyors from exceptional ones. [4]
Key Takeaways 📌
- GIS is now the central hub for property survey data, not an afterthought in CAD — combining boundaries, zoning, utilities, and environmental risk in one project. [4]
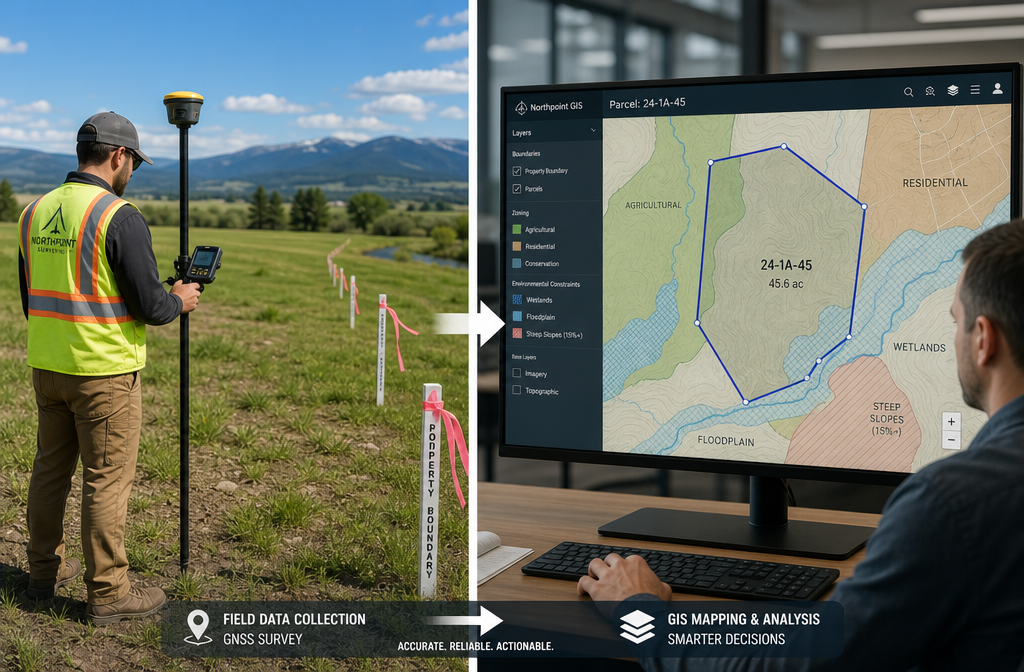
- Field surveying and GIS are complementary, not competing: GNSS and total stations provide centimetre-accurate boundaries; GIS adds the planning and environmental context. [2]
- Overlaying multiple data layers early in a project can reveal planning conflicts, utility clashes, and environmental constraints before they cause expensive redesigns. [4]
- Cloud GIS and web maps now allow surveyors to share live, layered data with planners, developers, and lenders in real time. [10]
- Employers and clients in 2026 expect surveyors to deliver GIS-ready datasets alongside traditional survey deliverables. [7]
Why GIS Has Become Non-Negotiable for Property Surveyors in 2026
The role of the property surveyor has expanded significantly. Clients no longer want just a boundary plan — they want to know what they can build, where the risks are, and what the constraints look like visually. GIS delivers all three.
Major consultancies like WSP now market surveying, mapping, and GIS as a single combined service, not three separate disciplines. Field surveys, aerial imagery, and LiDAR are integrated with GIS to support infrastructure routing, property acquisition, and environmental impact assessment. [8] For property surveyors working independently or within smaller firms, this sets the benchmark.
💬 "In current hiring and procurement, property clients and employers look for surveyors who can deliver not only accurate measurements but also GIS-driven insights into land-use opportunities and constraints." [5]
The Shift from CAD to GIS as the Primary Deliverable
Traditional CAD drawings are precise but static. A CAD file shows a boundary — it does not tell you whether that boundary crosses a flood zone, sits within a conservation area, or conflicts with an underground gas main. GIS does all of that simultaneously.
The recommended workflow for 2026 is clear [2]:
- Establish accurate survey control and parcel boundaries using GNSS rovers and total stations
- Import those datasets into a GIS platform (ArcGIS Pro, QGIS, or similar)
- Combine them with planning, environmental, and infrastructure layers
- Deliver both the precise boundary dataset and a GIS visualization of land-use context
This is now described as best practice by professional education providers for land surveyors. [2] For surveyors looking to understand the full scope of what modern survey work involves, the complete guide to what a surveyor checks during an inspection provides useful context on how field findings feed into broader assessments.
Step-by-Step: Building a Multi-Layer GIS Project for Property Surveys
This is the practical core of GIS Integration for Property Surveyors: Overlaying Data for Smarter Land Use Decisions in 2026. Follow these steps to build a GIS project that supports planning approvals, due-diligence reports, and client presentations.
Step 1: Set Up a Common Coordinate Reference System (CRS)
Before importing any data, define a single projected CRS for the entire project. In the UK, this is typically British National Grid (EPSG:27700). Every layer must be snapped to this system for accurate overlay. Mismatched CRS is the most common cause of layers appearing offset from each other. [4]
✅ Pro tip: Check the CRS of every incoming dataset before adding it to the project. Reproject if necessary — never assume.
Step 2: Import Survey-Grade Boundary and Topographic Data
Start with the most accurate data: the survey itself.
- Import GNSS-collected parcel boundaries and control points
- Add LiDAR-derived Digital Terrain Models (DTMs) for elevation context
- Include topographic survey data (spot heights, contours, drainage features)
This layer forms the spatial foundation of the entire project. Everything else is interpreted relative to it. [6]
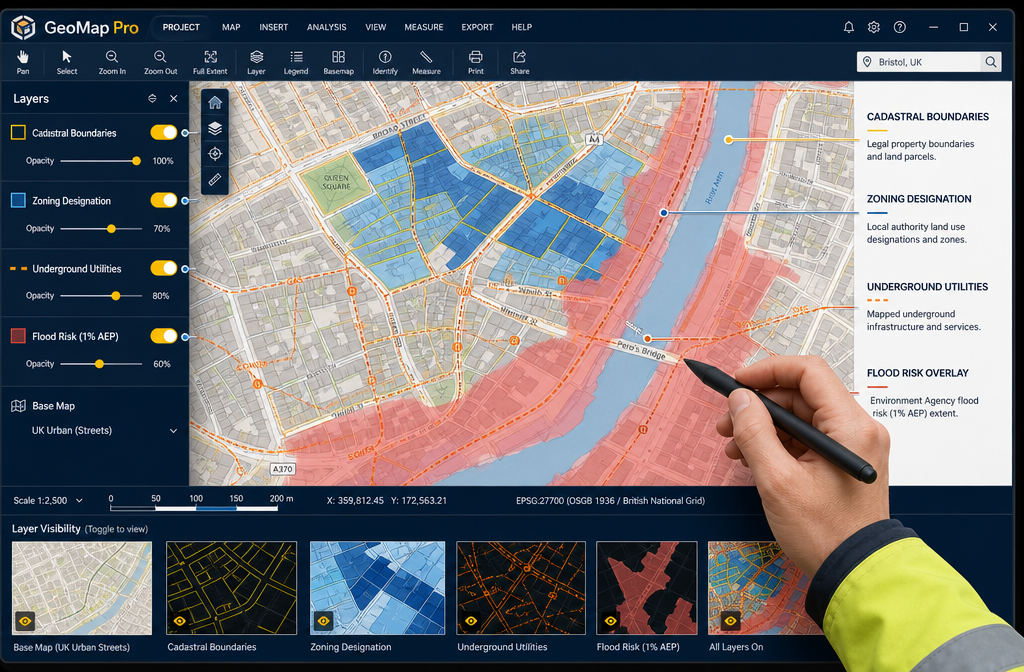
Step 3: Add Zoning and Planning Constraint Layers
| Layer Type | Source (UK) | What It Reveals |
|---|---|---|
| Local Development Plan zoning | Local Planning Authority | Permitted use classes, height limits |
| Conservation areas | Historic England / LPA | Design restrictions, permitted development limits |
| Green Belt / AONB designations | Natural England | Development restrictions |
| Tree Preservation Orders | LPA GIS portal | Protected trees within the site |
| Article 4 Directions | LPA | Removal of permitted development rights |
Overlay these with the survey boundary to immediately identify what can be built and where. A parcel that looks straightforward on a title plan may sit partly within a conservation area — a conflict invisible without the overlay. [4]
Step 4: Overlay Utility and Infrastructure Data
Underground utilities are among the most expensive surprises in development. Overlay:
- Gas, water, electricity, and telecoms as-built records (from utility companies or LSBUD/Dial Before You Dig)
- Sewer and drainage networks (from water authority GIS portals)
- Easements and rights of way from title register data
Cross-reference these with proposed building footprints to identify clashes early. A building footprint overlapping a high-pressure gas main easement is a show-stopper — far better discovered at feasibility stage than during planning. [4]
Step 5: Add Environmental Risk and Constraint Layers
Environmental constraints can determine whether a site is viable at all. Key layers include:
- 🌊 Flood Zone designations (Environment Agency Flood Map for Planning)
- 🏔️ Slope stability and landslide susceptibility (BGS data)
- 🌱 Soil type and agricultural land classification
- ☣️ Contaminated land registers (local authority records)
- 🦅 Ecological designations (SSSIs, Local Wildlife Sites)
Combining flood zone data with elevation models allows surveyors to identify the buildable envelope of a site — the area above the flood threshold and outside ecological buffers. [4] For projects involving groundwater risk, specialist groundwater sampling services may be required alongside the GIS analysis.
Step 6: Spatially Index Documents and Drawings
One of the most underused GIS capabilities for surveyors is spatial document indexing. Esri's guidance for survey organisations recommends linking all project documents — title deeds, historic surveys, photos, legal descriptions — to their geographic location so that clicking any parcel reveals the full document set. [3]
This transforms the GIS project from a map into a searchable spatial database — invaluable for due-diligence reports and planning applications.
Step 7: Publish a Web Map for Stakeholder Access
Once the layers are assembled and checked, publish the project as a web map using ArcGIS Online, QGIS Cloud, or a similar platform. This gives planners, developers, lenders, and legal teams real-time access to the same data without requiring GIS software on their end. [3]
Cloud GIS platforms are now mainstream in 2026, and sharing a live web map link with a client is increasingly standard practice. [10]
Visualization Tips: Making GIS Data Work in Client Reports
Accurate data is only valuable if it communicates clearly. Here are proven visualization strategies for GIS Integration for Property Surveyors: Overlaying Data for Smarter Land Use Decisions in 2026 that improve client reports and planning submissions.
Use Colour Consistently and Meaningfully
| Data Type | Recommended Colour | Rationale |
|---|---|---|
| Buildable area | Green | Positive, "go" signal |
| Flood risk zones | Blue / Red gradient | Intuitive water association |
| Utility easements | Orange | Warning, caution |
| Conservation areas | Purple | Heritage, distinct from risk |
| Survey boundary | Bold black | Precision, authority |
Consistent colour schemes across all project maps reduce confusion and build client confidence in the analysis.
Layer Transparency for Overlay Clarity
When stacking multiple constraint layers, use 30–50% transparency on upper layers so the base boundary and topography remain visible. Fully opaque overlays obscure the spatial relationships that make the analysis valuable.
Generate Scenario Maps
Rather than one complex map with all layers active, produce scenario-specific maps for each key question:
- "Where can we build?" — Buildable envelope map (flood zone + slope + ecological buffers removed)
- "Where are the utility risks?" — Utility clash map (footprints vs. easements)
- "What are the planning constraints?" — Zoning and designation map
This approach is particularly effective in client presentations and planning pre-application meetings. [5]
Integrate 3D Visualisation for Complex Sites
For larger development projects, linking GIS parcel data with BIM models enables 3D land-use analysis — shadow studies, view corridor assessments, and infrastructure capacity modelling that go well beyond 2D overlays. [9] This is an emerging capability that forward-thinking surveying firms are already offering as a premium service.
For surveyors working on commercial projects, commercial property surveying services increasingly incorporate this level of spatial analysis into feasibility and due-diligence workflows.
Mobile Field Data Collection
Esri's ArcGIS Survey123 and similar mobile GIS apps allow surveyors to capture field observations, photographs, and safety data directly into the GIS project from the field. [3] This eliminates transcription errors and keeps the project dataset current throughout the survey period.
The Skills and Tools Property Surveyors Need in 2026
Core GIS Platforms
| Platform | Best For | Cost |
|---|---|---|
| ArcGIS Pro | Enterprise, complex analysis | Subscription |
| QGIS | Open-source, full-featured | Free |
| ArcGIS Online | Web maps, collaboration | Subscription |
| MapInfo Pro | UK property/utilities sector | Subscription |
Key Competencies Employers Expect
The 2026 job market for property surveyors is clear: traditional surveying skills remain essential, but GIS proficiency is now a core competency, not a bonus. [7] Employers expect candidates who can:
- Manage and analyse spatial data in GIS platforms ✅
- Build and publish web maps for stakeholder use ✅
- Integrate data from multiple sources (LiDAR, GNSS, planning portals) ✅
- Deliver GIS datasets that planners and developers can use directly ✅
For surveyors building their professional profile, understanding the different types of surveyors and their specialisations helps identify where GIS skills add the most value — particularly in land, commercial, and development surveying roles.
Verifying GIS Competency
As with all professional skills, credentials matter. Surveyors adding GIS to their practice should ensure their qualifications are current and verifiable. The guide to verifying surveyor credentials in the UK is a useful reference for both practitioners and clients assessing GIS-enabled survey services.
Real-World Benefits: What Multi-Layer GIS Delivers for Property Projects
The practical case for GIS integration is compelling [4][6]:
- Fewer planning objections — conflicts with zoning, heritage, or ecology are identified and resolved before submission
- Faster due diligence — all spatial constraints visible in one project, reducing research time
- Reduced redesign costs — utility and easement clashes caught at feasibility, not construction
- Stronger client confidence — professional scenario maps communicate risk and opportunity clearly
- Competitive differentiation — GIS-enabled survey firms win more development and commercial work [5]
For property buyers and developers commissioning surveys, understanding the full scope of a building survey alongside GIS-enabled land analysis provides a much more complete picture of a property's potential and risks.
Conclusion: Actionable Next Steps for GIS-Enabled Surveying in 2026
GIS Integration for Property Surveyors: Overlaying Data for Smarter Land Use Decisions in 2026 is not a future aspiration — it is current best practice, and the gap between firms that have adopted it and those that have not is widening. [5][7]
Here are the concrete next steps to implement this workflow:
- Standardise your CRS — adopt British National Grid across all projects immediately
- Build a layer library — compile standard data sources (LPA portals, Environment Agency, utility registers) into a reusable project template
- Invest in one platform — commit to ArcGIS Pro or QGIS and build proficiency through structured training
- Add web map publishing to every client deliverable — even a simple shared map adds significant perceived value
- Document your GIS workflow — create a repeatable process that can scale across projects and team members
- Explore BIM–GIS integration for commercial and larger residential projects to unlock 3D analysis capabilities
The surveyors who thrive in 2026 and beyond will be those who deliver not just accurate measurements, but spatial intelligence — the ability to combine precise field data with planning, environmental, and infrastructure context to support smarter land use decisions. That capability starts with a well-structured GIS project and the skills to communicate its findings clearly.
References
[1] Integration Gis Land Surveying Benefits Applications Survey 2 Plan Xwfff – https://www.linkedin.com/pulse/integration-gis-land-surveying-benefits-applications-survey-2-plan-xwfff
[2] Geographic Information Systems Gis Land Surveying A Guide For Surveyors – https://www.mckissock.com/blog/land-surveyor/geographic-information-systems-gis-land-surveying-a-guide-for-surveyors/
[3] Five Ways Surveyors Can Leverage Gis – https://www.esri.com/en-us/industries/blog/articles/five-ways-surveyors-can-leverage-gis
[4] Gis Integration For Smarter Property Surveys Overlaying Data For Better Decision Making – https://princesurveyors.co.uk/blog/gis-integration-for-smarter-property-surveys-overlaying-data-for-better-decision-making/
[5] Gis Mastery For Surveyors Enhancing Data Analysis And Decision Making In Property Development – https://nottinghillsurveyors.com/blog/gis-mastery-for-surveyors-enhancing-data-analysis-and-decision-making-in-property-development
[6] The Integration Of Gis And Land Surveying Benefits And Applications – https://survey2plan.co.uk/the-integration-of-gis-and-land-surveying-benefits-and-applications/
[7] GeoInfo Academy – https://geoinfoacademy.com/blog/26
[8] Surveying Mapping And Gis – https://www.wsp.com/en-us/services/surveying-mapping-and-gis
[9] MDPI Applied Sciences – Integration of BIM and GIS – https://www.mdpi.com/2076-3417/14/23/11171
[10] The Future Of Geospatial Key Trends For 2026 – https://ngis.com.au/news/the-future-of-geospatial-key-trends-for-2026/